Predicting future FX support and resistance levels using mathematics

GBPUSD predictions for 20th April

I attach the VRM predictions for GBPUSD for tonight and tomorrow finishing 5 pm 20th April in New York.

The predictions are now in chart format and CSV format for input into charting systems. Predictions are in the column format of date, high, low, close, trend channel top, bottom and middle and 24 dual columns for the VRM levels. The last entry gives today's predictions and this week's predictions. The CSV file also gives past results for the VRM for back testing trading strategies. As the current day and week have not finished, the high, low and close entries are set to zero for these dates. The FX chart corresponds to the last daily and weekly CSV file entries.

Documents describing the Volatility Response Model (VRM) and the chart format can be found on the first post of this thread.

Predictions for VRM levels of EURGBP and EURUSD and 10 other FX pairs can be found at

https://www.complexhamiltoniansystems.com/fxcharts/

My current trading strategy is on page #20 post #157 of this thread.
 

Attachments

  • gbpusd.PNG
    gbpusd.PNG
    59.2 KB · Views: 161
  • GBP-USD-DAILY.CSV
    46 KB · Views: 149
  • GBP-USD-WEEKLY.CSV
    46 KB · Views: 128
GBPUSD high for the day close to weekly S1 sentiment level 1.4250. I guess all the sell orders were waiting there.

GBPUSD sold off down to daily level 1.4068. I have the low for the day as 1.40684.

VRM mouse had already predicted these levels

tvc_639dfe45c5a095dba06f118a3c6f8bda.png
 
GBPUSD fell out the bottom of the wedge today

VRM mouse had already predicted these levels

tvc_639dfe45c5a095dba06f118a3c6f8bda.png

The GBPUSD fell down out of your wedge today because the market was bearish. Why was the market bearish? Because it could not break upwards through the daily VRM sentiment levels especially daily sentiment level S1 at 1.4097
 
Last edited:
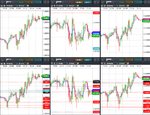
GBPUSD, EURGBP & EURUSD results for 20th April

Yesterday I attached the predicted support and resistance levels of GBPUSD of the Volatility Response Model (VRM) for today.

EURGBP and EURUSD VRM levels and 10 other FX pairs were on the website

https://www.complexhamiltoniansystems.com/fxcharts/

Here are the results for GBPUSD, EURGBP & EURUSD.

Weekly VRM levels in the top 30 minute charts, daily VRM levels in the bottom 30 minute charts. Times are GMT-4 . EMA channel (4,7) included.

Today the GBPUSD was always bearish as it could not break up through the daily S1 sentiment level 1.4097. I have the high for the day 1.40943

The GBPUSD fell to the middle of the long term trend channel at 1.4043 and found some support. But then fell through this level down to the daily short term trend bottom 1.4004 and finally hit the level 1.3997 just before close.

EURGBP bounced on its short term trend channel top 0.8787.


There were some large gaps between VRM levels to trade between.
 

Attachments

  • 2018-04-20-GBPUSD-EURGBP-EURUSD-30min.png
    2018-04-20-GBPUSD-EURGBP-EURUSD-30min.png
    350.5 KB · Views: 201
GBPUSD predictions for 23th April

I attach the VRM predictions for GBPUSD for tonight and tomorrow finishing 5 pm 23th April in New York.

The predictions are now in chart format and CSV format for input into charting systems. Predictions are in the column format of date, high, low, close, trend channel top, bottom and middle and 24 dual columns for the VRM levels. The last entry gives today's predictions and this week's predictions. The CSV file also gives past results for the VRM for back testing trading strategies. As the current day and week have not finished, the high, low and close entries are set to zero for these dates. The FX chart corresponds to the last daily and weekly CSV file entries.

Documents describing the Volatility Response Model (VRM) and the chart format can be found on the first post of this thread.

Predictions for VRM levels of EURGBP and EURUSD and 10 other FX pairs can be found at

https://www.complexhamiltoniansystems.com/fxcharts/

My current trading strategy is on page #20 post #157 of this thread.
 

Attachments

  • GBP-USD-WEEKLY.CSV
    46 KB · Views: 133
  • GBP-USD-DAILY.CSV
    46 KB · Views: 117
  • gbpusd.PNG
    gbpusd.PNG
    59.1 KB · Views: 166
Last edited:
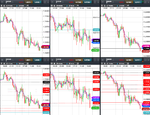
GBPUSD, EURGBP & EURUSD results for 23th April

Yesterday I attached the predicted support and resistance levels of GBPUSD of the Volatility Response Model (VRM) for today.

EURGBP and EURUSD VRM levels and 10 other FX pairs were on the website

https://www.complexhamiltoniansystems.com/fxcharts/

Here are the results for GBPUSD, EURGBP & EURUSD.

Weekly VRM levels in the top 1 hour charts, daily VRM levels in the bottom 30 minute charts. Times are GMT-4 . EMA channel (4,7) included.

Today the GBPUSD tried to rally twice through the weekly S1 sentiment level 1.4023 and failed. The GBPUSD high for the day was at the highest daily sentiment level 1.4029

The GBPUSD then fell to the daily level 1.3946 where it retraced and tried from 8:00 to 13:00 to break through. Finally breaking down through in the 14:00 hour.

There were some large gaps between VRM levels to trade between.
 

Attachments

  • 2018-04-23-GBPUSD-EURGBP-EURUSD-1hr-30min.png
    2018-04-23-GBPUSD-EURGBP-EURUSD-1hr-30min.png
    428.2 KB · Views: 167
GBPUSD predictions for 24th April

I attach the VRM predictions for GBPUSD for tonight and tomorrow finishing 5 pm 24th April in New York.

The predictions are now in chart format and CSV format for input into charting systems. Predictions are in the column format of date, high, low, close, trend channel top, bottom and middle and 24 dual columns for the VRM levels. The last entry gives today's predictions and this week's predictions. The CSV file also gives past results for the VRM for back testing trading strategies. As the current day and week have not finished, the high, low and close entries are set to zero for these dates. The FX chart corresponds to the last daily and weekly CSV file entries.

Documents describing the Volatility Response Model (VRM) and the chart format can be found on the first post of this thread.

Predictions for VRM levels of EURGBP and EURUSD and 10 other FX pairs can be found at

https://www.complexhamiltoniansystems.com/fxcharts/

My current trading strategy is on page #20 post #157 of this thread.
 

Attachments

  • gbpusd.PNG
    gbpusd.PNG
    59.3 KB · Views: 157
  • GBP-USD-DAILY.CSV
    46 KB · Views: 142
  • GBP-USD-WEEKLY.CSV
    46 KB · Views: 128
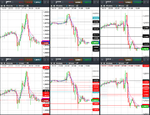
GBPUSD, EURGBP & EURUSD results for 24th April

Yesterday I attached the predicted support and resistance levels of GBPUSD of the Volatility Response Model (VRM) for today.

EURGBP and EURUSD VRM levels and 10 other FX pairs were on the website

https://www.complexhamiltoniansystems.com/fxcharts/

Here are the results for GBPUSD, EURGBP & EURUSD.

Weekly VRM levels in the top 30 minute charts, daily VRM levels in the bottom 30 minute charts. Times are GMT-4 . EMA channel (4,7) included.

Today the GBPUSD tested the daily low level 1.3921 twice which was the lowest daily sentiment level. At the same time EURUSD tested its low level at 1.2185 twice.

Then the GBPUSD rallied through its highest daily sentiment level 1.3967 taking 4 hours to do that.

Not a weekly VRM level in sight for the GBPUSD and EURUSD.

There were some large gaps between VRM levels to trade between.
 

Attachments

  • 2018-04-24-GBPUSD-EURGBP-EURUSD-30min.png
    2018-04-24-GBPUSD-EURGBP-EURUSD-30min.png
    397.8 KB · Views: 196
GBPUSD predictions for 25th April

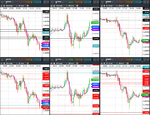
I attach the VRM predictions for GBPUSD for tonight and tomorrow finishing 5 pm 25th April in New York.

The predictions are now in chart format and CSV format for input into charting systems. Predictions are in the column format of date, high, low, close, trend channel top, bottom and middle and 24 dual columns for the VRM levels. The last entry gives today's predictions and this week's predictions. The CSV file also gives past results for the VRM for back testing trading strategies. As the current day and week have not finished, the high, low and close entries are set to zero for these dates. The FX chart corresponds to the last daily and weekly CSV file entries.

Documents describing the Volatility Response Model (VRM) and the chart format can be found on the first post of this thread.

Predictions for VRM levels of EURGBP and EURUSD and 10 other FX pairs can be found at

https://www.complexhamiltoniansystems.com/fxcharts/

My current trading strategy is on page #20 post #157 of this thread.
 

Attachments

  • GBP-USD-WEEKLY.CSV
    46 KB · Views: 118
  • GBP-USD-DAILY.CSV
    46 KB · Views: 113
  • gbpusd.PNG
    gbpusd.PNG
    59.5 KB · Views: 154
Yesterday I attached the predicted support and resistance levels of GBPUSD ...

Today the GBPUSD tried to rally twice through the weekly S1 sentiment level 1.4023 and failed. The GBPUSD high for the day was at the highest daily sentiment level 1.4029...

VRM mouse as usual predicting the level just fine.. :clap:

tvc_9bc29fa38db7aadf3819670798266264.png
 
VRM levels 23 April were calculated after the close on Friday 20th April

VRM mouse as usual predicting the level just fine.. :clap:

tvc_9bc29fa38db7aadf3819670798266264.png

The daily 1.4029 and weekly 1.4023 VRM levels for the market open 5pm New York 22 April were calculate after the Friday close 20 April and before the New York open. The weekly sentiment level 1.4023 is the lowest weekly sentiment level so that tells me the GBPUSD will be bearish for the week. This is called predicting the future.

Your level of 1.4033 is 10 pips away from the significant VRM weekly level 1.4023. That is potentially 10% of a day's range for the GBPUSD. You present your level today. That is called hindsight.
 
.....This is called predicting the future.... You present your level today....That is called hindsight.
You chuck a few lines on the chart then tell us which ones were hit afterwards :rolleyes:, this is VRM hindsight :clap:

Your level of 1.4033 is 10 pips away from the significant VRM weekly level 1.4023...

VRM mouse drew the line a few pips out on purpose to expose your foolery, and it worked a treat ;)
 
You guys can argue among yourselves, but I think we can all agree that my Spectrum Levels have nailed it once again.
 

Attachments

  • SpectrumII.JPG
    SpectrumII.JPG
    144.2 KB · Views: 125
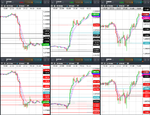
GBPUSD, EURGBP & EURUSD results for 25th April

Yesterday I attached the predicted support and resistance levels of GBPUSD of the Volatility Response Model (VRM) for today.

EURGBP and EURUSD VRM levels and 10 other FX pairs were on the website

https://www.complexhamiltoniansystems.com/fxcharts/

Here are the results for GBPUSD, EURGBP & EURUSD.

Weekly VRM levels in the top 30 minute charts, daily VRM levels in the bottom 30 minute charts. Times are GMT-4 . EMA channel (4,7) included.

GBPUSD high for the day was at the highest daily sentiment level 1.3989

Once GBPUSD broke down through its daily sentiment S1 level 1.3975 it was downhill for EURGBP and EURUSD as they were already below their daily S1 sentiments levels of 0.8752 and 1.2235 respectively

GBPUSD low for the day was at daily sentiment level 1.3925

There were some large gaps between VRM levels to trade between.
 

Attachments

  • 2018-04-25-GBPUSD-EURGBP-EURUSD-30min.png
    2018-04-25-GBPUSD-EURGBP-EURUSD-30min.png
    330.7 KB · Views: 113
GBPUSD predictions for 26th April

I attach the VRM predictions for GBPUSD for tonight and tomorrow finishing 5 pm 26th April in New York.

The predictions are now in chart format and CSV format for input into charting systems. Predictions are in the column format of date, high, low, close, trend channel top, bottom and middle and 24 dual columns for the VRM levels. The last entry gives today's predictions and this week's predictions. The CSV file also gives past results for the VRM for back testing trading strategies. As the current day and week have not finished, the high, low and close entries are set to zero for these dates. The FX chart corresponds to the last daily and weekly CSV file entries.

Documents describing the Volatility Response Model (VRM) and the chart format can be found on the first post of this thread.

Predictions for VRM levels of EURGBP and EURUSD and 10 other FX pairs can be found at

https://www.complexhamiltoniansystems.com/fxcharts/

My current trading strategy is on page #20 post #157 of this thread.
 

Attachments

  • GBP-USD-WEEKLY.CSV
    46 KB · Views: 125
  • GBP-USD-DAILY.CSV
    46 KB · Views: 127
  • gbpusd.PNG
    gbpusd.PNG
    59.5 KB · Views: 126
GBPUSD, EURGBP & EURUSD results for 26th April

Yesterday I attached the predicted support and resistance levels of GBPUSD of the Volatility Response Model (VRM) for today.

EURGBP and EURUSD VRM levels and 10 other FX pairs were on the website

https://www.complexhamiltoniansystems.com/fxcharts/

Here are the results for GBPUSD, EURGBP & EURUSD.

Weekly VRM levels in the top 30 minute charts, daily VRM levels in the bottom 30 minute charts. Times are GMT-4 . EMA channel (4,7) included.

GBPUSD sold off down to the daily sentiment level 1.3904.

Then rallied up to the daily level 1.4006 and missed that by 7 pips.

Then fell down and tested 1.3904 again. Then closed at daily sentiment level 1.3918.

EURGBP had a large movement from the long term trend channel middle 0.8742 down to the weekly level 0.8683.

There were some large gaps between VRM levels to trade between.
 

Attachments

  • 2018-04-26-GBPUSD-EURGBP-EURUSD-30min.png
    2018-04-26-GBPUSD-EURGBP-EURUSD-30min.png
    404.8 KB · Views: 89
GBPUSD predictions for 27th April

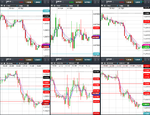
I attach the VRM predictions for GBPUSD for tonight and tomorrow finishing 5 pm 27th April in New York.

The predictions are now in chart format and CSV format for input into charting systems. Predictions are in the column format of date, high, low, close, trend channel top, bottom and middle and 24 dual columns for the VRM levels. The last entry gives today's predictions and this week's predictions. The CSV file also gives past results for the VRM for back testing trading strategies. As the current day and week have not finished, the high, low and close entries are set to zero for these dates. The FX chart corresponds to the last daily and weekly CSV file entries.

Documents describing the Volatility Response Model (VRM) and the chart format can be found on the first post of this thread.

Predictions for VRM levels of EURGBP and EURUSD and 10 other FX pairs can be found at

https://www.complexhamiltoniansystems.com/fxcharts/

My current trading strategy is on page #20 post #157 of this thread.
 

Attachments

  • gbpusd.PNG
    gbpusd.PNG
    59.9 KB · Views: 100
  • GBP-USD-DAILY.CSV
    46 KB · Views: 128
  • GBP-USD-WEEKLY.CSV
    46 KB · Views: 127
GBPUSD, EURGBP & EURUSD results for 27th April

Yesterday I attached the predicted support and resistance levels of GBPUSD of the Volatility Response Model (VRM) for today.

EURGBP and EURUSD VRM levels and 10 other FX pairs were on the website

https://www.complexhamiltoniansystems.com/fxcharts/

Here are the results for GBPUSD, EURGBP & EURUSD.

Weekly VRM levels in the top 30 minute charts, daily VRM levels in the bottom 30 minute charts. Times are GMT-4 . EMA channel (4,7) included.

GBPUSD tested the daily sentiment level 1.3935 before falling through daily S1 sentiment level 1.3924 in advance of the UK GDP announcement.

On the GDP announcement the GBPUSD fell to level 1.3806 and retraced for about an hour before finally falling to level 1.3767.

GBPUSD level 1.3806 then became a resistance level.

Meanwhile EURUSD fell to the bottom of the long term trend channel at 1.2072 and bounced back up.

There were some large gaps between VRM levels to trade between.
 

Attachments

  • 2018-04-27-GBPUSD-EURGBP-EURUSD-30min.png
    2018-04-27-GBPUSD-EURGBP-EURUSD-30min.png
    359.2 KB · Views: 98
Top