Predicting future FX support and resistance levels using mathematics

GBPUSD, EURGBP, EURUSD, USDCAD & EURCAD results for 28th January 2020

Volatility Response Model (VRM) described in the first post of this thread.

EURCAD added to complete another triplet. Now there are two triplets.

EURGBP X GBPUSD = EURUSD
EURUSD X USDCAD = EURCAD

The FX pairs follow each other about their respective VRM levels. Good for additional trading signals !

Here are the results for the GBPUSD, EURGBP, EURUSD, USDCAD & EURCAD at end of day 28th January 2020

The daily VRM charts below now only display the highest , lowest and S1 sentiments levels. These are the most important sentiment levels.

ONE FILE ATTACHED

FIRST FILE


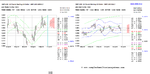
Weekly VRM levels in the top 1 hour. Daily VRM levels in the bottom 1 hour charts. Times are GMT-4 . EMA channel (4,7) included. All charts show the mid-price between the bid and the offer . DAILY LEVELS VALID FOR LAST 24 HOURS ONLY

VRM levels for GBPUSD, EURGBP & EURUSD were posted yesterday by 6 pm (NY time) for today just finished ahead of Friday's Brexit


GBPUSD found resistance at its daily S1 sentiment level 1.3063 and then fell to its weekly level 1.2981 & daily level 1.2974.

EURGBP started with support on its daily S1 sentiment level 0.8435. And made its high as GBPUSD made its low.

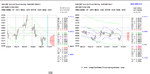
EURUSD started unable to break up through its lowest daily sentiment level 1.1021. Then fell to daily level 1.0997. Then followed GBPUSD upwards

USDCAD followed EURCAD to its high then fell with EURCAD to its low at weekly S1 sentiment level 1.3156

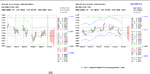
EURCAD rose to its high at daily S1 sentiment level 1.4551. Then fell to its daily level 1.4502

2020-01-28-GBPUSD-EURGBP-EURUSD-USDCAD-EURCAD-1hr-1hr.png
 
This week for each day in advance of Brexit I will post the VRM predictions for GBPUSD, EURGBP & EURUSD. These form a triplet by arbitrage according to:

EURGBP X GBPUSD = EURUSD

Now I attach the VRM charts for GBPUSD, EURGBP & EURUSD for 29th January. Weekly VRM levels shown to the left ending next Friday in NY and daily VRM levels to the right ending 5 pm NY time tomorrow night.

The coloured levels are the important VRM levels. Plot these on a chart together with an EMA(4,7) channel and watch the price action react with them. I use 15 minute , 30 minute and 1 hour candlesticks. Look for large gaps between levels.

I will post the VRM predictions each day by 7 pm (GMT-4) for these three FX pairs the next day.

Let's see what happens
 

Attachments

  • gbpusd.PNG
    gbpusd.PNG
    62.7 KB · Views: 95
  • eurgbp.PNG
    eurgbp.PNG
    61.5 KB · Views: 104
  • eurusd.PNG
    eurusd.PNG
    59.9 KB · Views: 118
GBPUSD, EURGBP, EURUSD, USDCAD & EURCAD results for 29th January 2020 - US Fed Interest Rate Decision

Volatility Response Model (VRM) described in the first post of this thread.

EURCAD added to complete another triplet. Now there are two triplets.

EURGBP X GBPUSD = EURUSD
EURUSD X USDCAD = EURCAD

The FX pairs follow each other about their respective VRM levels. Good for additional trading signals !

Here are the results for the GBPUSD, EURGBP, EURUSD, USDCAD & EURCAD at end of day 29th January 2020

The daily VRM charts below now only display the highest , lowest and S1 sentiments levels. These are the most important sentiment levels.

ONE FILE ATTACHED

FIRST FILE


Weekly VRM levels in the top 1 hour charts. Daily VRM levels in the bottom 1 hour charts. Times are GMT-4 . EMA channel (4,7) included. All charts show the mid-price between the bid and the offer . DAILY LEVELS VALID FOR LAST 24 HOURS ONLY

VRM levels for GBPUSD, EURGBP & EURUSD were posted yesterday by 6 pm (NY time) for today just finished ahead of Friday's Brexit


GBPUSD unable to break up through daily S1 sentiment level 1.3023. And made its low when EURUSD made its low

EURGBP fell between its highest weekly sentiment level 0.8460 and its weekly S1 sentiment level 0.8453 and was trapped and is still trapped there at this post.

EURUSD unable to break up through its daily S1 sentiment level 1.1027. And fell to its low at about daily level 1.0995. Before rallying for the Fed interest rate decision.

USDCAD supported by its weekly S1 sentiment level 1.3156 and its daily S1 sentiment level 1.3154. Then rallied to its daily level 1.3196

EURCAD low at its daily level 1.4480. And rallied with USDCAD

2020-01-29-GBPUSD-EURGBP-EURUSD-USDCAD-EURCAD-1hr-1hr.png
 
Last edited:
This week for each day in advance of Brexit I will post the VRM predictions for GBPUSD, EURGBP & EURUSD. These form a triplet by arbitrage according to:

EURGBP X GBPUSD = EURUSD

Now I attach the VRM charts for GBPUSD, EURGBP & EURUSD for 30th January. Weekly VRM levels shown to the left ending next Friday in NY and daily VRM levels to the right ending 5 pm NY time tomorrow night.

The coloured levels are the important VRM levels. Plot these on a chart together with an EMA(4,7) channel and watch the price action react with them. I use 15 minute , 30 minute and 1 hour candlesticks. Look for large gaps between levels.

I will post the VRM predictions each day by 7 pm (GMT-4) for these three FX pairs the next day.

Let's see what happens

gbpusd.PNG

eurgbp.PNG

eurusd.PNG
 
GBPUSD, EURGBP, EURUSD, USDCAD & EURCAD results for 30th January 2020 - BoE Interest Rate Decision

Volatility Response Model (VRM) described in the first post of this thread.

EURCAD added to complete another triplet. Now there are two triplets.

EURGBP X GBPUSD = EURUSD
EURUSD X USDCAD = EURCAD

The FX pairs follow each other about their respective VRM levels. Good for additional trading signals !

Here are the results for the GBPUSD, EURGBP, EURUSD, USDCAD & EURCAD at end of day 30th January 2020

The daily VRM charts below now only display the highest , lowest and S1 sentiments levels. These are the most important sentiment levels.

ONE FILE ATTACHED

FIRST FILE


Weekly VRM levels in the top 30 minute charts. Daily VRM levels in the bottom 30 minute charts. Times are GMT-4 . EMA channel (4,7) included. All charts show the mid-price between the bid and the offer .

VRM levels for GBPUSD, EURGBP & EURUSD were posted yesterday by 6 pm (NY time) for today just finished ahead of Friday's Brexit


GBPUSD again found support on its weekly level 1.2981. And rallied on UK news to daily level 1.3110

EURGBP unable to break up through the middle of its short term trend channel at 0.8475. And fell to daily level 0.8417

EURUSD followed GBPUSD and EURGBP today.

USDCAD supported at its daily S1 sentiment level 1.3194. And rallied to its highest weekly sentiment level 1.3217, which was also its highest daily sentiment level. Daily and weekly historical data calculate the same sentiment level. Amazing.

EURCAD rallied from its low to daily level 1.4590

2020-01-30-GBPUSD-EURGBP-EURUSD-USDCAD-EURCAD-30min-30min.png
 
This week for each day in advance of Brexit I will post the VRM predictions for GBPUSD, EURGBP & EURUSD. These form a triplet by arbitrage according to:

EURGBP X GBPUSD = EURUSD

Now I attach the VRM charts for GBPUSD, EURGBP & EURUSD for 31st January - BREXIT DAY. Weekly VRM levels shown to the left ending tomorrow Friday in NY and daily VRM levels to the right ending 5 pm NY time tomorrow night.

The coloured levels are the important VRM levels. Plot these on a chart together with an EMA(4,7) channel and watch the price action react with them. I use 15 minute , 30 minute and 1 hour candlesticks. Look for large gaps between levels.

I will post the VRM results tomorrow night after NY close.

Let's see what happens

gbpusd.PNG

eurgbp.PNG

eurusd.PNG
 
GBPUSD finally arrive at the weekly H1=1.3200 calculated by the VRM. The GBPUSD started at its low weekly VRM level L3=1.2981 yesterday. I posted these levels last Sunday (post #820) before the market opened.

You also have to watch EURGBP and EURUSD since they form the triplet

EURGBP X GBPUSD = EURUSD

and interact with each other about there respective VRM levels.

2020-01-31-GBPUSD-1hr-2days-weekly.png
 
GBPUSD, EURGBP, EURUSD, USDCAD & EURCAD results for 31st January 2020 - BREXIT DAY !!!!. All VRM levels for GBPUSD, EURGBP & EURUSD posted throughout the week.

Volatility Response Model (VRM) described in the first post of this thread.

EURCAD added to complete another triplet. Now there are two triplets.

EURGBP X GBPUSD = EURUSD

EURUSD X USDCAD = EURCAD

The FX pairs follow each other about their respective VRM levels. Good for additional trading signals !

Here are the results for the GBPUSD, EURGBP, EURUSD, USDCAD & EURCAD at end of day 31st January 2020

The daily VRM charts below now only display the highest , lowest and S1 sentiments levels. These are the most important sentiment levels.

TWO FILES ATTACHED

FIRST FILE


Weekly VRM levels in the top 1 hour charts. Daily VRM levels in the bottom 1 hour charts . Daily VRM levels only valid for the last 24 hours. Times are GMT-4 . EMA channel (4,7) included. All charts show the mid-price between the bid and the offer.

GBPUSD started with support on the middle of its short term trend channel at 1.3085. Rose to weekly level 1.3200

EURGBP had its high at its daily S1 sentiment level 0.8430. And fell to its daily level 0.8390

EURUSD made its low as GBPUSD and EURGBP hit their retrospective daily levels. Then rose to daily level 1.1096

USDCAD has support at its daily S1 sentiment level 1.3205. Then rose to daily level 1.3247

EURCAD supported at its daily sentiment level 1.4557. Then rose to daily level 1.4681

SECOND FILE

Shows the 3 hour candlestick charts with EMA channel (4.7) throughout the week with weekly VRM levels for the 5 FX pairs. All charts show the mid-price between the bid and the offer.

GBPUSD - fell to its weekly level 1.2981. Then rose to its weekly level 1.3200

EURGBP made its high as GBPUSD made its low then fell for the rest of the week.

EURUSD made its low as EURGBP found support on its weekly S1 sentiment level 0.8453. Then rallied to its lowest weekly sentiment level 1.1041. Then rallied with GBPUSD today.

USDCAD found support at its weekly S1 sentiment level 1.3156. Then rallied to weekly level 1.3248

EURCAD found support about its weekly S1 sentiment level 1.4504. Then rallied with EURUSD

2020-01-31-GBPUSD-EURGBP-EURUSD-USDCAD-EURCAD-1hr-1hr.png

2020-01-31-GBPUSD-EURGBP-EURUSD-USDCAD-EURCAD-3hr.png
 
GBPUSD, EURGBP, EURUSD, USDCAD & EURCAD results for 3rd February 2020

Volatility Response Model (VRM) described in the first post of this thread.

EURCAD added to complete another triplet. Now there are two triplets.

EURGBP X GBPUSD = EURUSD
EURUSD X USDCAD = EURCAD

The FX pairs follow each other about their respective VRM levels. Good for additional trading signals !

Here are the results for the GBPUSD, EURGBP, EURUSD, USDCAD & EURCAD at end of day 3rd February 2020

The daily VRM charts below now only display the highest , lowest and S1 sentiments levels. These are the most important sentiment levels.

ONE FILE ATTACHED

FIRST FILE


Weekly VRM levels in the top 1 hour charts. Daily VRM levels in the bottom 1 hour charts. Times are GMT-4 . EMA channel (4,7) included. All charts show the mid-price between the bid and the offer . Weekly and daily levels are valid for the first 24 hour start to the week.

GBPUSD - the GBP sell off was immediately apparent on the open in NY. GBPUSD opened in NY below its weekly S1 sentiment level 1.3191. EURGBP opened with support on its weekly S1 sentiment level 0.8410. EURUSD opened below its weekly S1 sentiment level 1.1099. By arbitrage then GBPUSD was going to be extremely sold off. In the end GBPUSD fell through most of its weekly and daily L levels

EURGBP started with support on its weekly S1 sentiment level 0.8410. And rose to the middle of its long term trend channel at 0.8509

EURUSD fell to the middle of its short term trend channel at 1.1058

USDCAD was trapped between its daily S1 sentiment level 1.3233 and its highest daily sentiment level 1.3249 until 11:00 (GMT-4) when it attempted to reach the top of its short term trend channel at 1.3310.

EURCAD tried to initially break up through the middle of its short term trend channel at 1.4690 and failed. Dropped to the middle of its long term trend channel at 1.4626. Then rallied with USDCAD

2020-02-03-GBPUSD-EURGBP-EURUSD-USDCAD-EURCAD-1hr-1hr.png
 
GBPUSD, EURGBP, EURUSD, USDCAD & EURCAD results for 4th February 2020

Volatility Response Model (VRM) described in the first post of this thread.

EURCAD added to complete another triplet. Now there are two triplets.

EURGBP X GBPUSD = EURUSD
EURUSD X USDCAD = EURCAD

The FX pairs follow each other about their respective VRM levels. Good for additional trading signals !

Here are the results for the GBPUSD, EURGBP, EURUSD, USDCAD & EURCAD at end of day 4th February 2020

The daily VRM charts below now only display the highest , lowest and S1 sentiments levels. These are the most important sentiment levels.

ONE FILE ATTACHED

FIRST FILE


Weekly VRM levels in the top 1 hour charts. Daily VRM levels in the bottom 1 hour charts. Times are GMT-4 . EMA channel (4,7) included. All charts show the mid-price between the bid and the offer . Daily levels were valid for the last 24 hours ending 5 pm NY time.

GBPUSD fell to its daily level 1.2948 just above the bottom of its short term trend channel 1.2935. then rallied to its highest daily sentiment level at 1.3040

EURGBP - as GBPUSD made its low at its daily level 1.2948, EURGBP made its high at daily level 0.8535. Shows how FX pairs are coordinated about their respective VRM levels. Then EURGBP fell to its daily level 0.8470 just above the middle of its short term trend channel at 0.8461.

EURUSD looked on and finally fell through the middle of its short term trend channel at 1.1054 to its daily level 1.1034

USDCAD made its high as EURCAD made its high at 1.4710. Then fell to its lowest daily sentiment level 1.3268

EURCAD made its high at the top of its short term trend channel at 1.4710. Then fell to its daily level 1.4647

2020-02-04-GBPUSD-EURGBP-EURUSD-USDCAD-EURCAD-1hr-1hr.png
 
GBPUSD, EURGBP, EURUSD, USDCAD & EURCAD results for 5th February 2020

Volatility Response Model (VRM) described in the first post of this thread.

EURCAD added to complete another triplet. Now there are two triplets.

EURGBP X GBPUSD = EURUSD
EURUSD X USDCAD = EURCAD

The FX pairs follow each other about their respective VRM levels. Good for additional trading signals !

Here are the results for the GBPUSD, EURGBP, EURUSD, USDCAD & EURCAD at end of day 5th February 2020

The daily VRM charts below now only display the highest , lowest and S1 sentiments levels. These are the most important sentiment levels.

ONE FILE ATTACHED

FIRST FILE


Weekly VRM levels in the top 1 hour charts. Daily VRM levels in the bottom 1 hour charts. Times are GMT-4 . EMA channel (4,7) included. All charts show the mid-price between the bid and the offer . Daily levels were valid for the last 24 hours ending 5 pm NY time.

GBPUSD initially supported by its daily S1 sentiment level 1.3011. rallied to its high at daily level 1.3065. Then fell to its low at daily level 1.2961

EURGBP initially resisted by its daily S1 sentiment level 0.8482. Fell to its low at daily level 0.8441. Then rallied to its high at its highest daily sentiment level 0.8488

EURUSD failed to break up through its lowest daily sentiment level 1.1045. Then fell through its daily level 1.1021

USDCAD moved sideways supported by its lowest daily sentiment level 1.3263

EURCAD unable to break up through its highest daily sentiment level 1.4674. Then fell through the middle of its long term trend channel at 1.4626

2020-02-05-GBPUSD-EURGBP-EURUSD-USDCAD-EURCAD-1hr-1hr.png
 
GBPUSD, EURGBP, EURUSD, USDCAD & EURCAD results for 6th February 2020

Volatility Response Model (VRM) described in the first post of this thread.

EURCAD added to complete another triplet. Now there are two triplets.

EURGBP X GBPUSD = EURUSD
EURUSD X USDCAD = EURCAD

The FX pairs follow each other about their respective VRM levels. Good for additional trading signals !

Here are the results for the GBPUSD, EURGBP, EURUSD, USDCAD & EURCAD at end of day 6th February 2020

The daily VRM charts below now only display the highest , lowest and S1 sentiments levels. These are the most important sentiment levels.

ONE FILE ATTACHED

FIRST FILE


Weekly VRM levels in the top 1 hour charts. Daily VRM levels in the bottom 1 hour charts. Times are GMT-4 . EMA channel (4,7) included. All charts show the mid-price between the bid and the offer . Daily levels were valid for the last 24 hours ending 5 pm NY time.

GBPUSD followed EURGBP today. GBPUSD made its high when EURGBP made its low at its daily S1 sentiment level 0.8460. GBPUSD made its low when EURGBP made its high at its weekly level 0.8495.

EURGBP made its low at daily S1 sentiment level 0.8460. Made its high at weekly level 0.8495.

EURUSD unable to break up through its lowest daily sentiment level 1.1002. Fell to its low about its weekly level 1.0961

USDCAD moved sideways with support at its lowest daily sentiment level 1.3269

EURCAD high for the day at the middle of its long term trend channel 1.4626. Then finally fell through the middle of its short term trend channel 1.4598

2020-02-06-GBPUSD-EURGBP-EURUSD-USDCAD-EURCAD-1hr-1hr.png
 
GBPUSD, EURGBP, EURUSD, USDCAD & EURCAD results for 7th February 2020 - US Non farms payroll

Volatility Response Model (VRM) described in the first post of this thread.

EURCAD added to complete another triplet. Now there are two triplets.

EURGBP X GBPUSD = EURUSD

EURUSD X USDCAD = EURCAD

The FX pairs follow each other about their respective VRM levels. Good for additional trading signals !

Here are the results for the GBPUSD, EURGBP, EURUSD, USDCAD & EURCAD at end of day 7th February 2020

The daily VRM charts below now only display the highest , lowest and S1 sentiments levels. These are the most important sentiment levels.

TWO FILES ATTACHED

FIRST FILE


Weekly VRM levels in the top 1 hour charts. Daily VRM levels in the bottom 1 hour charts . Daily VRM levels only valid for the last 24 hours. Times are GMT-4 . EMA channel (4,7) included. All charts show the mid-price between the bid and the offer.

GBPUSD unable to break up through all its daily sentiment levels. High at daily sentiment level 1.2954. Fell to daily level 1.2886

EURGBP tried to break up through its weekly level again at 0.8495 and fell back. Then tried a second time in a rally that started as GBPUSD started to fall from its high.

EURUSD was always bearish below its lowest daily sentiment level 1.0989. Then finally fell with GBPUSD.

USDCAD supported by its daily S1 sentiment level 1.3181. And made its high at daily level 1.3323.

EURCAD high at weekly sentiment level 1.4615. Low at daily level 1.4555

SECOND FILE

Shows the 3 hour candlestick charts with EMA channel (4.7) throughout the week with weekly VRM levels for the 5 FX pairs. All charts show the mid-price between the bid and the offer.

GBPUSD -fell through the middle of its long term trend channel at 1.3161. Tried to rally back above its weekly L levels at 1.3073 and failed. Then fell through all its weekly levels.

EURGBP fell from the middle of its long term trend channel at 0.8509. Down to its highest weekly sentiment level 0.8431. Then tried twice to break through weekly level 0.8495

EURUSD was bearish below its weekly S1 sentiment level 1.1099 at the beginning of the week. And fell below its weekly L level 1.0961

USDCAD started the week above its lowest weekly sentiment level 1.3228. And rallied upwards with support on its highest weekly sentiment level 1.3280

EURCAD was supported by the middle of its long term trend channel at 1.4628 at the beginning of the week. But then fell to its weekly level 1.4568

`2020-02-07-GBPUSD-EURGBP-EURUSD-USDCAD-EURCAD-1hr-1hr.png

2020-02-07-GBPUSD-EURGBP-EURUSD-USDCAD-EURCAD-3hr.png
 
Last edited:
GBPUSD, EURGBP, EURUSD, USDCAD & EURCAD results for 10th February 2020

Volatility Response Model (VRM) described in the first post of this thread.

EURCAD added to complete another triplet. Now there are two triplets.

EURGBP X GBPUSD = EURUSD
EURUSD X USDCAD = EURCAD

The FX pairs follow each other about their respective VRM levels. Good for additional trading signals !

Here are the results for the GBPUSD, EURGBP, EURUSD, USDCAD & EURCAD at end of day 10th February 2020

The daily VRM charts below now only display the highest , lowest and S1 sentiments levels. These are the most important sentiment levels.

ONE FILE ATTACHED

FIRST FILE


Weekly VRM levels in the top 1 hour charts. Daily VRM levels in the bottom 1 hour charts. Times are GMT-4 . EMA channel (4,7) included. All charts show the mid-price between the bid and the offer . Weekly and daily levels are valid for the first 24 hour start to the week.

GBPUSD started the week unable to break up through its weekly S1 sentiment level 1.2909. And fell to the bottom of its short term trend channel at 1.2875. Then rallied to its high at daily level 1.2948.

EURGBP started the week with support on its daily S1 sentiment level 0.8489 and rallied to its highest daily sentiment level 0.8505. Then fell to daily level 0.8444

EURUSD unable to break up through its lowest daily sentiment level 1.0954. And fell with EURGBP

USDCAD found support on its daily sentiment level 1.3290. And rallied to its highest daily sentiment level 1.3324

EURCAD unable to break up through its daily S1 sentiment level 1.4580. And fell to its daily level 1.4531

2020-02-10-GBPUSD-EURGBP-EURUSD-USDCAD-EURCAD-1hr-1hr.png
 
GBPUSD, EURGBP, EURUSD, USDCAD & EURCAD results for 11th February 2020

Volatility Response Model (VRM) described in the first post of this thread.

EURCAD added to complete another triplet. Now there are two triplets.

EURGBP X GBPUSD = EURUSD
EURUSD X USDCAD = EURCAD

The FX pairs follow each other about their respective VRM levels. Good for additional trading signals !

Here are the results for the GBPUSD, EURGBP, EURUSD, USDCAD & EURCAD at end of day 11th February 2020

The daily VRM charts below now only display the highest , lowest and S1 sentiments levels. These are the most important sentiment levels.

ONE FILE ATTACHED

FIRST FILE


Weekly VRM levels in the top 1 hour charts. Daily VRM levels in the bottom 1 hour charts. Times are GMT-4 . EMA channel (4,7) included. All charts show the mid-price between the bid and the offer . Daily levels were valid for the last 24 hours ending 5 pm NY time.

GBPUSD unable to break down through its daily S1 sentiment level 1.2911. Rallied to its daily level 1.2964

EURGBP unable to break up through its daily S1 sentiment level 0.8454. Fell to its daily level 0.8418

EURUSD followed. Low at daily level 1.0896. High at its lowest daily sentiment level 1.0921

USDCAD continued its fall of yesterday and made its low at daily level 1.3277

EURCAD continued its fall of yesterday and made its low at daily level 1.4496

2020-02-11-GBPUSD-EURGBP-EURUSD-USDCAD-EURCAD-1hr-1hr.png
 
GBPUSD, EURGBP, EURUSD, USDCAD & EURCAD results for 12th February 2020

Volatility Response Model (VRM) described in the first post of this thread.

EURCAD added to complete another triplet. Now there are two triplets.

EURGBP X GBPUSD = EURUSD
EURUSD X USDCAD = EURCAD

The FX pairs follow each other about their respective VRM levels. Good for additional trading signals !

Here are the results for the GBPUSD, EURGBP, EURUSD, USDCAD & EURCAD at end of day 12th February 2020

The daily VRM charts below now only display the highest , lowest and S1 sentiments levels. These are the most important sentiment levels.

ONE FILE ATTACHED

FIRST FILE


Weekly VRM levels in the top 1 hour charts. Daily VRM levels in the bottom 1 hour charts. Times are GMT-4 . EMA channel (4,7) included. All charts show the mid-price between the bid and the offer . Daily levels were valid for the last 24 hours ending 5 pm NY time.

Well that was easy ! EUR sell off with GBPUSD looking on and USDCAD following EURCAD down


GBPUSD trapped between its daily S1 sentiment level 1.2943 and its highest daily sentiment level 1.2996

EURGBP fell from its daily S1 sentiment level 0.8427 down to the bottom of its short term trend channel 0.8385

EURUSD could not break up through its daily S1 sentiment level 1.0925. And fell to its weekly level 1.0873 / bottom of its short term trend channel 1.0870

USDCAD followed EURCAD down making its low at weekly level 1.3242

EURCAD fell from its lowest weekly sentiment level 1.4515. Down to weekly level 1.4407

2020-02-12-GBPUSD-EURGBP-EURUSD-USDCAD-EURCAD-1hr-1hr.png
 
GBPUSD, EURGBP, EURUSD, USDCAD & EURCAD results for 13th February 2020

Volatility Response Model (VRM) described in the first post of this thread.

EURCAD added to complete another triplet. Now there are two triplets.

EURGBP X GBPUSD = EURUSD
EURUSD X USDCAD = EURCAD

The FX pairs follow each other about their respective VRM levels. Good for additional trading signals !

Here are the results for the GBPUSD, EURGBP, EURUSD, USDCAD & EURCAD at end of day 13th February 2020

The daily VRM charts below now only display the highest , lowest and S1 sentiments levels. These are the most important sentiment levels.

ONE FILE ATTACHED

FIRST FILE


Weekly VRM levels in the top 1 hour charts. Daily VRM levels in the bottom 1 hour charts. Times are GMT-4 . EMA channel (4,7) included. All charts show the mid-price between the bid and the offer . Daily levels were valid for the last 24 hours ending 5 pm NY time.


GBPUSD low for the day at its lowest daily sentiment level 1.2946. Then rallied to daily level 1.3057 / weekly level 1.3052

EURGBP unable to break up through its daily S1 sentiment level 0.8392. And fell to its low at the bottom of its long term trend channel at 0.8305

EURUSD unable to break up through its lowest daily sentiment level 1.0886. And fell to the bottom of its short term trend channel at 1.0841

USDCAD supported by its weekly level 1.3242

EURCAD unable to break up through its daily S1 sentiment level 1.4427. And fell to daily level 1.4371

2020-02-13-GBPUSD-EURGBP-EURUSD-USDCAD-EURCAD-1hr-1hr.png
 
GBPUSD, EURGBP, EURUSD, USDCAD & EURCAD results for 14th February 2020

Volatility Response Model (VRM) described in the first post of this thread.

EURCAD added to complete another triplet. Now there are two triplets.

EURGBP X GBPUSD = EURUSD

EURUSD X USDCAD = EURCAD

The FX pairs follow each other about their respective VRM levels. Good for additional trading signals !

Here are the results for the GBPUSD, EURGBP, EURUSD, USDCAD & EURCAD at end of day 14th February 2020

The daily VRM charts below now only display the highest , lowest and S1 sentiments levels. These are the most important sentiment levels.

TWO FILES ATTACHED

FIRST FILE


Weekly VRM levels in the top 1 hour charts. Daily VRM levels in the bottom 1 hour charts . Daily VRM levels only valid for the last 24 hours. Times are GMT-4 . EMA channel (4,7) included. All charts show the mid-price between the bid and the offer.

GBPUSD trapped between its highest and lowest daily sentiment levels 1.3062 and 1.3017. No timescales from 1 to 8 days could take the lead.

EURGBP low at the bottom of its long term trend channel 0.8305. High at daily level 0.8345

EURUSD low at daily level 1.0830. High at its daily S1 sentiment level 1.0860

USDCAD low at weekly level 1.3242. High at daily S1 sentiment level 1.3263

EURCAD low at daily level 1.4352. High at its lowest daily sentiment level 1.4387

SECOND FILE

Shows the 3 hour candlestick charts with EMA channel (4.7) throughout the week with weekly VRM levels for the 5 FX pairs. All charts show the mid-price between the bid and the offer.

GBPUSD broke through its weekly S1 sentiment level 1.2909. And made its high at weekly level 1.3052

EURGBP fell from its lowest weekly sentiment level 0.8492. Fell down through many weekly levels down to the bottom of its long term trend channel at 0.8305

EURUSD fell through its lowest weekly sentiment level 1.0946. And broke down through the bottom of its long term trend channel at 1.0848

USDCAD tried to rally through its weekly S1 sentiment level 1.3309. And fell to weekly level 1.3242

EURCAD fell down through its lowest weekly sentiment level 1.4515. And fell to weekly level 1.4362

2020-02-14-GBPUSD-EURGBP-EURUSD-USDCAD-EURCAD-1hr-1hr.png

2020-02-14-GBPUSD-EURGBP-EURUSD-USDCAD-EURCAD-3hr.png
 
GBPUSD, EURGBP, EURUSD, USDCAD & EURCAD results for 17th February 2020

Volatility Response Model (VRM) described in the first post of this thread.

EURCAD added to complete another triplet. Now there are two triplets.

EURGBP X GBPUSD = EURUSD
EURUSD X USDCAD = EURCAD

The FX pairs follow each other about their respective VRM levels. Good for additional trading signals !

Here are the results for the GBPUSD, EURGBP, EURUSD, USDCAD & EURCAD at end of day 17th February 2020

The daily VRM charts below now only display the highest , lowest and S1 sentiments levels. These are the most important sentiment levels.

ONE FILE ATTACHED

FIRST FILE


Weekly VRM levels in the top 1 hour charts. Daily VRM levels in the bottom 1 hour charts. Times are GMT-4 . EMA channel (4,7) included. All charts show the mid-price between the bid and the offer . Weekly and daily levels are valid for the first 24 hour start to the week.

GBPUSD tried to start the week with support (bullish) on its daily S1 sentiment level 1.3041. EURGBP started the week above (bullish) its daily S1 sentiment level 0.8300. But EURUSD started the week below (bearish) its daily S1 sentiment level 1.0851. As

EURGBP X GBPUSD = EURUSD

something had to give. That was GBPUSD which fell through its daily S1 sentiment level and sold off as EURGBP rose.

EURGBP rose to its highest daily sentiment level 0.8333

EURUSD moved sideways unable to break up through its daily S1 sentiment level 1.0851

USDCAD fell with EURCAD

EURCAD fell from its weekly S1 sentiment level 1.4368. Down to its daily level 1.4328

2020-02-17-GBPUSD-EURGBP-EURUSD-USDCAD-EURCAD-1hr-1hr.png
 
GBPUSD, EURGBP, EURUSD, USDCAD & EURCAD results for 18th February 2020

Volatility Response Model (VRM) described in the first post of this thread.

EURCAD added to complete another triplet. Now there are two triplets.

EURGBP X GBPUSD = EURUSD
EURUSD X USDCAD = EURCAD

The FX pairs follow each other about their respective VRM levels. Good for additional trading signals !

Here are the results for the GBPUSD, EURGBP, EURUSD, USDCAD & EURCAD at end of day 18th February 2020

The daily VRM charts below now only display the highest , lowest and S1 sentiments levels. These are the most important sentiment levels.

ONE FILE ATTACHED

FIRST FILE


Weekly VRM levels in the top 1 hour charts. Daily VRM levels in the bottom 1 hour charts. Times are GMT-4 . EMA channel (4,7) included. All charts show the mid-price between the bid and the offer . Daily levels were valid for the last 24 hours ending 5 pm NY time.

GBPUSD made its low as EURGBP made its high at daily level 0.8351. GBPUSD made its high at its highest daily sentiment level 1.3044

EURGBP made its high at daily level 0.8351. Made its low at daily level 0.8282

EURUSD trapped betrween its lowest daily sentiment level 1.0837 and its daily level 1.0823 before falling to daily level 1.0783

USDCAD rallied from its daily S1 sentiment level 1.3232 up to the middle of its short term trend channel 1.3277

EURCAD high at its weekly S1 sentiment level 1.4368 / daily S1 sentiment level 1.4369. Low at the bottom of its short term trend channel 1.4307

2020-02-18-GBPUSD-EURGBP-EURUSD-USDCAD-EURCAD-1hr-1hr.png
 
Top