Practical examples of volume use on intra day US shares

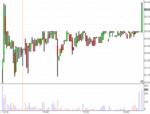
Lovely short Sir, excellent timing at both ends. And at the bottom, plenty of time to close at a really good price as the price action sags and does not lift.

Talking of Casinos, you are a man after my own heart.

I am a member of several.

I never gamble. But I like the atmosphere of gambling rooms. I am a member of several in London.

These Casinos treat me very well. I go there from time to time and I am given free food and tea or coffee.

I also on occasion take my friends, and when on occasion I do take stock market chums, I point out to them how it is that there are no windows, no clocks, and how it is that the public queue to buy their chips, but how you never see a queue of winners queueing up to collect their winnings.

Casinos can provide very useful and free lessons to traders who are able to impartially observe how it is that here we have a mechanism that for all its apparent sophistication and glamour, and glint of hidden promise, is designed to relentlessly fleece people who enter unprepared and unaware.
 
Indeed, what you say points up a basic reality, Socrates.
With the gambling scenario of casinos, only the casinos win long term (with very few exceptions).
With the probability scenario of trading, only those who trade with the market makers or specialists win long term.
Or to put it another way, play the "game" for "fun" - lose;
master the "game" and play professionally and unemotionally - win.
Richard
 
Yes, precisely. And I forgot to mention another contrast which is as follows :~ you see groups of people obsessively playing at the fruit machines and other groups slowly wandering around with their hands in their pockets looking very glum.
icon12.gif
 
Ah ! Yes, I have just remembered to add....but the croupiers, the inspectors, the barmen, the waitresses and even the doorman are always very cheerful indeed....and always smiling and laughing and joking...they are truly delightful places to visit for all these reasons.
 
I wasn’t sure what was happening – and still am not!
The fifth and sixth bars, with price rising rapidly, showed no increase (5th) or reduced(6th) volume. Seventh and eighth showed modest increase, price still rising. The greatest volume was on the 9th and 10th bars, when the price started to reverse.

Was the price being marked up on low volume by market makers and was this then followed by panic buying by traders, supplied by market makers who then shorted the stock?

The price subsequently dropped twice (19th and 26th bars) Were these tests to see if there were weak holders of stock? If so the low volume suggested that there were no panic sellers.

The huge volume on the 49th bar was really confusing. I too wondered if it was data error. I don’t think it would have been unreasonable of Richard to have included an example of data error since such errors can occur. Was it a market maker who had finished buying or selling on behalf of a client transferring a block of shares to or from his own account to finish the transaction? The huge volume was on a bar which spiked down, like a test, but if it was a test the volume would have indicated considerable supply and that it would be inadvisable to mark the price up. And why didn’t increased volume show on the previous two tests, if that is what they were? I suppose that since the price did not fall further despite the very great volume new buyers must have suddenly appeared and that was why the price then rose. Hindsight is wonderful.

I hope Socrates will explain “I think the last bar is a feint, and that actually this is going to rocket skywards.” and “Later on I returned to it and pinned the fact that the plausibility of the facts as presented only served to disguise hidden intent to the contrary”

Rob
 
Yes, I will in due course RobQ as soon as I have a minute, very busy at the moment suddenly.
 
"I don’t think it would have been unreasonable of Richard to have included an example of data error since such errors can occur."
You might not think it unreasonable of me, Bobby, but I would have thought it dishonourable to waste people's time and effort by using such a data error and wouldn't dream of doing so :)
However, I think your point (and Jump Off's and roguetrader's) is very well made and is a lesson for everybody - extreme data may well be an error.
As for your bar by bar analysis of price and volume, I can't comment on that as I don't read sentiment that way. I look for things which stand out as being potentially significant and are not just noise or are statistically insignificant.
If something stands out like a sore thumb I view it sceptically too. The reality is that many volume spikes are genuine but not necessarily significant. Block trades, late trades etc can produce unimportant spikes. Do they affect price or not? What happens afterwards?
For me, those are the keys.
Volume alerts me.
If things continue so constructively here I will post more examples from my teaching database of when, for me, volume matters. They are all contemporaneous screen shots of my entries and exits and are illustrations of my personal approach.
This is the first time for a very long time I have been able to post my views/trades on the open boards of t2w without abusive posts which the mods have then deleted, or received personally abusive emails or PMs.
The mods more vigorous approach has on rare occasions been too extreme in my opinion, but they have been correct the vast majority of the time and deserve appreciation for their refuse disposal activities.
What a pleasure.
Richard
 
robq said:
The huge volume on the 49th bar was really confusing. I too wondered if it was data error.

Part of why this bar looked so odd was because we were zoomed in to one little segment. If you look at the larger view Richard posted later, you will see this vol bar was big, but not unreasonable. If you had been watching the tick screen, I'm guessing you would have seen that bar drop easily on moderate volume, and then a Woosh! as the buyers chased the sellers all the way up to nearly the top.

JO

Edit: Also, if you were familiar with this stock, you would know if this kind of volume was "in the range of normalcy."
 
Hello JumpOff,
In fact the first chart was of all the trading up to that time - four hours - so it was within context.
However, the point about seeing volume spikes in an overall context is also apposite. Software scales in accordance with the highest volume thus far.
You are precisely correct in saying that looking at a tick chart would have shown exactly what you suggest.
I think you will find the reaction to that move on a 1 minute c'stick would have shown the same thing.
Anyone can go and check on their own feeds.
Spot on, JO, if you don't mind me saying so.
Richard
 
Re-your edit, JO,
Wow! Yes, I have seen similar behaviour intra day from WYNN before recently and that is one of the reasons it remains on my radar. ;-)
Richard
 
"Part of why this bar looked so odd was because we were zoomed in to one little segment. If you look at the larger view Richard posted later, you will see this vol bar was big, but not unreasonable. If you had been watching the tick screen, I'm guessing you would have seen that bar drop easily on moderate volume, and then a Woosh! as the buyers chased the sellers all the way up to nearly the top."

The volume on that 5 min bar (from Prophet.net) was 344,691. Average daily volume (from Traderbot) 3,699,986, it was the highest 5 minute volume bar for 7 days.
Rob
 
Last edited:
Right, I'm back. This volume bar that is bothering all of you....

What happens is that there are configurations in some software packages that develop the volume bar in real time whilst the price bar is being formed. One can tell before the bar is formed whether the volume bar is going to be a biggie or a smallie. That is one detail for you to think about.

The next thing for you to think about is whether in the process of collection a shift occured causing the collecting programme to multiply the volume collected by a factor of ten. This ought not to happen but it does occur from time to time. It is the result of the way that the figures are released by the exchange.

There are additionally two basic types of volume display, rigid format and flexible format.

In rigid format all the bars are displayed as they appear and are not necessarily to scale in the strictest sense visually.

In flexible format the bars are formed and are compressed in order that they conform to the scale of the bars that precede them.

Another alternative is that the large volume bar is declared late, and for that reason appears out of sync with the price action.

The last alternative is that the volume bar is rogue data.

When you have a proper feel for price time volume and intent, you instinctively know when a bar is wrong and does not make sense and for which probable reason as a result of experience.

You immediately take this in your stride and consequently crop the bar to the correct length estimated.
You may not need to crop the bar physically, but just cropping it in your head and holding the image there is sufficient.

Rogue bars formed in flexible format crush the preceding bars to make them look vey small by comparison.

As the previous bars in the volume display are not crushed by the telegraph pole bar the conclusion is that the display is in rigid format. As such the conclusion must be that the volume declared is wrong either because it iis rogue or because it is accumulated delayed or a combination of both, but it indicates nevertheless that something serious has happened that is not part of the previous volumetric flow and display.

Hence the only conclusion that can be arrived at is that the last volume bar has to be snap accumulation in advance of a realisically potential price explosion.
 
Next Part:~
#######

Now in the chart displayed, and I am not even looking at it but doing it from memory, we see in the left hand side a very steep price rise with increasing volume. The price culminates and the next bar is down and leads to sagging with declining volume. Thereafter the price meaners with very narrow spreads and very very low volume. The price does not recover, it gains a bit of ground, it loses a bit of ground, in other words, the price action is not conclusive.

There are several way of viewing this and the difficulty is to choose the correct view and the one that realistically applies.

It is very odd that after such a powerful move suddenly interest is lost and the price meanders with such little volume attributable to it and not looking very strong. It is not looking very strong because it is made not to look very strong on purpose. And so it meanders along with an inference that would induce many people to go short.

Now suddenly, decisively, the price is dropped sharply on the last bar. Further shorts pile in. Additionally there is covert accumulation taking place. When all this is complete, the price is snapped up to take out the shorts and as a consequence of the combined tactic one would expect increased volume.

The stage is now set for the fulfillment of the original intent, which unfolds quickly as a rapid move upwards. This catches a lot of people who do not expect it completely by surprise.
By the formation of the bars and the volume attributable to them, I can tell that a lot of the volume is the consequence of bears being forced to close out their shorts early if they have a stoploss and later on if they have not.

The bulls now get on board and take the price to a higher level. But this higher level ends in momentum, and this momentum causes temporary exhaustion and volatility to follow.
Now we have to watch what happens once the volatility is able to calm down.
 
Final Part:~
########

All of what I explain above is read on a horizontal ticket.
Level 2 is a vertical ticket. The skill is in indentifying where the sledgehammer is going to hit and in which direction. The final manoevre gave the clue. I am certain that in a vertical ticket it should also be very clear.
Naz and Mr Charts have their methods, my methodology is different, but all these things are in harmony with one another regardless of the angle from which it is viewed, but the view itself must be correct.
 
Would anyone care to exercise their minds and say what happened next and why?
Would you have gone long, short or not traded it?
This is a 1 min candle chart with volume at the bottom.
Richard
 
Last edited:
Only two opinions out of so many views..............come on...............everybody has an opinion on t2w !
Thanks to Trojan and Bobbie
Richard
 
weird looking chart.......... market order sell , stop reverse @19 but I dont like it..... probably be sitting watchin saying kin ell........ so i wouldnt take it.... what did happen next ?
 
Top