pratbh said:
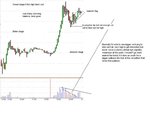
Soc updated his opinion late last night. When he first wrote his comments, I was surprised to read that he thought the stock was going to fall. There was a breakout, followed by a springboard on low volume, then a hammer on huge volume. Subsequently Soc has updated his comments which I didn't notice (should have).
Chump, I don't see any reason of deleting my comments, mods can always delete them if they feel the comments were negative.
However, I won't post any more on any of Richard's threads (I usually don't). Hope that helps.
This will interest you Pratbh:~
Since you appear to be so concerned and surprised at what I say or do not say, there is no need for it, but just for my personal satisfaction I am giving you a full explanation, as follows:
I do not dither and hum and haw about the merits or the demerits of a particular instrument or otherwise, as I am invariably very busy, but I am able to multitask other things whilst trading. This is because I have the whole thing and myself within it totaly under control. Having said this, I am normally able to suss a chart in seconds. This is as a consequence of very long experience and a deep understanding accumulated and perfected over a long period of time. It does not mattter to me what the instrument is, or its price, or the timeframe in which the chart is displayed.
This ability to suss a given scenario as presented by a chart in seconds, which is super fast micro analysis, contains a very large element of subconscious element input. This subconscious element input is even faster than logical or deductive thought. It is invariably right., unerringly right, but it is separate to logical deduction and reasoning and acts as an adjunct to it. The result is like a two pronged attack, and not a single stab, are you with me so far ?
The chart presented looked so "clean" as to be deceptive, (as roguetrader mentions in his post above), that I attacked it with a single stab mode and posted. No sooner had I posted that I had the intuitive flash that my posture was not correct, but had no time to deal with it as I had to attend to an incoming call from overseas ( I only have two hands you know).
Later on I returned to it and pinned the fact that the plausibility of the facts as presented only served to disguise hidden intent to the contrary. I decided to leave it as it was for a very good reason.
Last year, Mr Charts posted a chart and challenged all of us to foretell what would happen next. I pounced on it within one minute of it appearing and assesed it correctly and was able to post the answer within the same minute. No sooner had I posted, than it was followed by (if I remember correctly) 11 posts. Only seven of these ventured to offer a view. And nearly all of these views coincided with the view (underpinned by my reasoning)that I had already headed the list with. This to me was very dissappointing and the reason was simply that I was prevented from observing members coming forward with views untainted by my header reply.
I will look for the relevant posts and the thread and come back with them for your interest.
So on this occasion I decided to leave the wrong assessment unchanged on pupose to see if anybody would venture to challenge or ask.
It now happens that you venture to challenge and ask within the comfort of hindsight.
I left it as it was and decided to alter it late at night when there are less poeple looking and when there is a minimal chance of anyone either being influenced by it or venturing to challenge any more.
I then proceeded to outline roughly the reasons for the alteration, and those are the facts.