A real plan seperates the consistent winners from those that crack pins at levels, win a few, lose a few - maybe make a bit of profit but don't really get anywhere and hit their objectives.
so true
Last edited:
A real plan seperates the consistent winners from those that crack pins at levels, win a few, lose a few - maybe make a bit of profit but don't really get anywhere and hit their objectives.
guess who me a "dummy" who can't wait but always just wants to rush in and then guess what my plan sets up bye then i have either blown my account or can't put up a big enough s l
yes i am a t****r
Another little tip I only found out yesterday lol
If your hourly levels are showing up on your daily TF it can get a little messy, so you can:
- Double click on the hourly levels
- Right click
- Choose "horizontal line properties"
- Go to the "visualisation" tab
- Uncheck the box that says "show on all timeframes"
- Then you can put a tick in the "h1" box
Hey presto, hourly levels only show up on the hourly TF. But you can still see your daily levels on the hourly too 🙂
Probably all right for you short termers...but that's going to 957. Tomorrow.

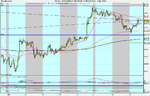
Cable current;y finding resistance at the confluence of
a. previous 1hr swing lo zone
b. Weekly r1 pivot
c. Underside of breeched 4hr ascending support trend line
Mni also touted offers in the 6440-50 region. 4hr pic is shown below. Uptrend is strong however and extends to weekly chart.
G/L
My news feed has a 'Market Talk' story - Is that it for GBP/USD?
I guess it's time to go long cable.......

*&%@*!!!!
I accidently put on a corn position 10 times bigger than intended. I am a plonker.
I was wondering why my margin requirements were so drastic. 😆
Now rectified.
*&%@*!!!!
I accidently put on a corn position 10 times bigger than intended. I am a plonker.
I was wondering why my margin requirements were so drastic. 😆
Now rectified.
Went Long on the corn ETF today with my IG Index SB acct with real money, but only a small position (£2/p) 'coz I still have my "L" plates. Where have the CORNY traders got their stops? I have mine at 170.0 for the Corn ETC. Wondering if this is too close?
Regards, Chris
Not sure about the ETF. Why did you crack that?
You would want your stop below 434 1/2 in Corn if you are trading it off the daily IB setup.
I have mine at 170.0 for the Corn ETC.
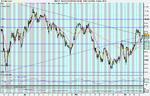
DOW target 9000 not yet hit, but 8850 was major resistance,...
usdjpy
And still is... nice short opportunity there today, but I missed it while having dinner.
All these premarket and overnight moves lately ... :-/