Dax trade: +73 pips
I put in £200 today and did my first trade. Long Dax. Made £73.
So, up £273. (they haven't put the other £200 in yet)
TD, can I enquire of your Dax trade by way of how I might have analysed it at the time.
I am making an assumption here that your Dax trade was triggered off the 11:00 pin on the Hourly chart. If this is not the case then it will invalidate some of the issue.
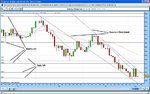
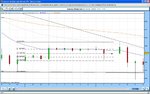
Prior to the hourly pin forming, I might have drawn the Weekly SR levels at 5131, 4507.8, 4065, 4003. I should certainly have drawn the Daily SR levels. I have them at 4136.5, 3787.4, 3655.1 plus an apparent Downtrend. (See Dax-Daily.jpg)
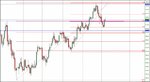
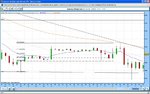
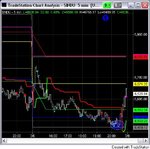
I might then be watching the Hourly chart. At 11:00 on the Hourly Chart (Dax-Hourly.jpg) a 'good' pin forms (which you would actually see complete at 11:59).
It appears to meet resistance of the Daily 3655 level and forms at the 68% fib. However it is an indication of a counter trend.
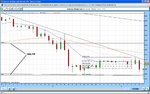
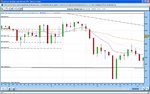
Let's say we accept the counter trend and now look at the Hourly plus 1 (Dax-Hourly-(+1).jpg. The 12:00 candle shows that a Buy order would have been opened but that the trade is sitting at a loss. How would you determine that this was still a valid trade at this point?
One way might be to drop to a 30 Min chart. If we do this (Dax-30Mins-(+1.5).jpg) we see that we still have a pin (maybe coincidence), it takes between 12:00 and 12:30 for our entry and stays below the entry level until 12:30 (actually 12:59). Again, how would you determine that this was still a good trade? Are you relying on your initial analysis?
What about looking at the 10 Min chart? (Dax-10Mins-(+1.5).jpg).
We see that the bulk of our original Hourly pin formed at 11:10/11:20 from a 2 candle combo (mentioned elsewhere so interesting to see this). This shows that our buy order would have been triggered between 12:00 and 12:09. However, this candle actually indicates a 'reverse' pin which might suggest that the trade has now finished any up move and will now reverse, which it does for the next 30/40 mins.
All the above would surely suggest not to stay in trade, although it does then move upwards significantly after this.
If this was indeed the pin you traded, did you just hold with your original Hourly pin through to the second hour after entry? I'm sure if I made this trade it would actually have turned down against me. Perhaps this is your 'feel' for the market that you often talk about.
Obviously if this was not your trade then it may not be so significant. However, it would be good to get your take on the analysis please.
Webinvester