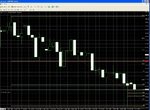
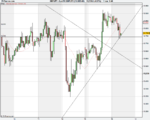
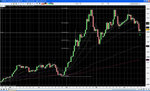
Anybody watching EurCad. Its reached a level last seen in Feb 2004 and a pin has formed on the hourly, although not the best Pin on my charts.
There's not much else to go by and I would be cautious going counter trend off the hourly but its an interesting level and may be worth keeping an eye on.
There's not much else to go by and I would be cautious going counter trend off the hourly but its an interesting level and may be worth keeping an eye on.