Best Thread Potential setups

Status
Not open for further replies.
psn is also on my radar
 

Attachments

  • PERSIMMON.png
    PERSIMMON.png
    10.5 KB · Views: 187
hi yawl, just read a PM i got a few days ago,...1st i apologize for the delay, and 2nd i apologize for not replying as i deleted the message by mistake!!! here is the indicator you asked for...it simply draws candles over the chart of a different TF.

the second highlights a time period of your choice,useful for quick visual representation of trading sessions.
hope it helps.(y)
 

Attachments

  • CustomCandle.mq4
    8.5 KB · Views: 210
  • i-ParamonWorkHighLow.mq4
    5.2 KB · Views: 207
  • update.gif
    update.gif
    15.7 KB · Views: 155
Hey Guys,
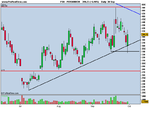
Just a short note of interest. I know I have said before about drawing your SR lines and Pivots on the Line charts and not the H/Ls of the candles. When you plot your Fibs in the same way (H/Ls from the line chart) then just look how accurate the confluence becomes!

I know you can achieve the same by using the bases/tops of the candle body; Try it, you'll be amazed! (well, not the old and bold amongst you!)

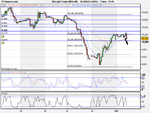
I'm out of the market today as I think the whipsaws are too big for me to stomach! The gold H4 pin from Fri has not been broken (the high) yet I'm confused on gold and I think the world is a little confused and not knowing where to turn. I think cash may be the safest holding over the next few weeks (providing the governments don't go and print too much more paper money)

Looks like Bill Bonner hit the nail on the head in his book a couple of years ago, 'Empire of Debt'; a good economic read.

Good trading all, and monitor those open positions closely!
Grim


Hi Grim

Have looked at this a bit recently and this definitely has merit.
Came across this just know while looking for info on Fib time zones.
YouTube - Swing Trading Fibonacci Time Zones
which backs up what you were saying
Anyone else use this method with their S/R lines to give an indication on when the market might produce another swing?
Have been reading about it in Dynamic Trading book and have been looking for a tool that might be able to draw these in automatically rather than manually calculating and drawing them in. Still early days in my study so will keep researching.


cheers

Simon
 
just my 2ps worth on drawing trendlines from the close price instead of the extremes....
check out superspurs post (1990 on page 199) if he had drawn his trend line from the close price his chart woudnt make any sense!!! i agree this method gives a more accurate picture of price movement(sometimes)but you have to ask the question are these lines tradable??imo the only time the shadows should be ignored(generally speaking) is on the pin bars with long noses,other wise your gonna find a lot of false breaks!!
like i said jus my 2ps worth :)
p.s. just a not on the fibs..if ,for e.g. ,there is a 10% shadow above the close price high and a 10% shadow below the close price low the fibs would be the same no???not done the maths but seems likely,also in the testing that i have done the difference is minimal and remembering tht a pivot price is more a zone than a defo price it doesnt make much difference in my experience,the key is to be consistent in your method and you will find the best way to track n trade the instrument
 
i,ll have a look at this in the am,for the isa.either get in on the break of the high of the candle or with a bit of luck a pullback

Hi superspurs

may sound like a stupid question....
the break of the candle you are refering to is on your weekly chart? does the next pin not materialise next monday morning? I presume weekly charts on uk stocks run from 8am monday to 1630 friday?

thanks

Simon
 
Hey Spurs
Hope you have managed to steer clear of all the turmoil? LOL

How do you get on with ProRealtime? You charts are really nice and clear. I find sharecope charts are not as clear and easy to read. Is your feed expensive?
Cheers
Grim
 
just my 2ps worth on drawing trendlines from the close price instead of the extremes....
check out superspurs post (1990 on page 199) if he had drawn his trend line from the close price his chart woudnt make any sense!!! i agree this method gives a more accurate picture of price movement(sometimes)but you have to ask the question are these lines tradable??imo the only time the shadows should be ignored(generally speaking) is on the pin bars with long noses,other wise your gonna find a lot of false breaks!!
like i said jus my 2ps worth :)
p.s. just a not on the fibs..if ,for e.g. ,there is a 10% shadow above the close price high and a 10% shadow below the close price low the fibs would be the same no???not done the maths but seems likely,also in the testing that i have done the difference is minimal and remembering tht a pivot price is more a zone than a defo price it doesnt make much difference in my experience,the key is to be consistent in your method and you will find the best way to track n trade the instrument

Hey Jon!
Fair point but it's horses for courses the way I see it. I suppose each style has its downfalls and merits? I prefer the close/open as its a reflection of levels that the market participents were happy with at that time, not the rejected levels of the wicks. Whatever works for you I think. I was just alerting people to the fact. Be interested to know what the seasoned traders think (Omni, BSD,TD etc)
 
depends what market you are trading, and what timeframe;

simple example, Equities on the Daily - it can be difficult to move shares after exchange hours (AFAIK; Dark pools may have changed this, you may be able to hedge the position on another exchange if the stock is listed there, etc...), so close prices have added significance. A Head of Desk may impose O'night risk limits on his traders, and loosen these up during the day.

In short: The close price represents a price that the market can sleep over, Hi's and lo's are not necessarily so.
 
hi grim,i love prorealtime,i only use EOD free.i have set proscreener for inside bars,outside bars,alarms set on various trendlines,loads of lists,its great.i might get a subscription soon see what its like live.they do a free week trial if you fancy having a look.

as for the carnage i stayed in cash after the ved trade in the isa,but got whipped a little bit trying to play intraday on forex,spreads, not to much damage though.
 
Crude forming 1hr pin

1hr pin on US crude oil at 50%fib plus S/R line of 10040
 

Attachments

  • US Light Crude (NOV-08).png
    US Light Crude (NOV-08).png
    22.5 KB · Views: 173
collection of hourly PB's have formed on GBP/USD.. could be taking a breather before continuing downward trend
 
Usdjpy

Hey Guys

I'm watching USDJPY on the 1hr time frame. Its in a wedge pattern at the underside of a downward trendline.

I'm not sure which direction it will go but its worth watching

Shane
 
Eurchf

Daily pin forming on the EURCHF of a reasonably decent pivot (i think?)
Problems are the desending trendlines coming down overhead so i think it may run in to trouble before any decent RR i gained. Risk =140ish, reward at first short term TL is 90ish at 15920, next is at pivot 16000, then 16235.

picture.php


picture.php


anyone have any constructive crititism/comments?
 
I wqouldnt bother with that skelly its completely covered by the previous bar - ie: not sticking out into a 'new' price area. Looks a good level though so worth keeping an eye on.

Everything looks really 'scruffy' at the moment to me, cant see anything. Ive been trying to whip a demo account up from 100k to 1 mill to pass the time. On third account so far :LOL:

Hey 1Pipped,
Ya, your right about the bar, but as you say a good level. if you zoom further out on the weekly you can see price has moved around it alot back along.

I've been finding it hard to see setups for the last while also. i've tried getting on a couple of trades with a view to holding them for a few days, and even if they start ok, they reverse leaving me out for loss or for pittens.

no nice clear cut moves where price moves along they way i would want it- ie off an obvious TL or support/resistance, and then move off again in the planned direction!-bold price!

I'm also watching AUDUSD. Good price level on that at the moment.

Good luck with the magic mill!!!

Shane
 
Status
Not open for further replies.
Top