Best Thread Potential setups

Status
Not open for further replies.
Thanks Tom, do you think 1.3646 is a sensible final target for the completion of the daily H&S? I agree there may be an intervening retrace to 1.4050.

Regards, Chris

Hi Chris,

I personally look at each level on the way down and if the price action seems to show a reversal is imminent, I play it. So, for example, if we made a pin on the hourly right here, I would probably look to go long rather than stubbornly playing for a "bigger" target to the downside.

It just depends on the type of trader you are. I know one trader that is short Euro/Usd and is looking for parity (lol) and is sitting tight with his position through every move it makes to the upside. Swear down.
 
its you isnt it lol

No it's not - I have the same opinion but unlike this trader who is a close friend of mine, I haven't done tens of thousands of pounds playing an "opinion". hehehe

I'm short right now from 1.4019.

Took 1/3 off at 1.3965 and got a stop at 1.4040 for the rest. I personally think if we come back above 1.4000 on this second attempt then we'll see 1.4050 (along with my stop :))
 
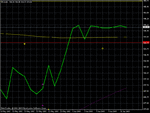
gbpusd 4hr

Cable's current intraday low (6327) is at the 76.4% of the 6235-6620 move up.... there are no significant fibs to the downside until 38.2% of 4389-6661 at that Mon low 5797 area.

The chart below is 4hr in respect of potential supp/res on that t/f, the top and bottom previous swing hix2 / previous swing lo/hi/lo zone respectively being co-existant on the daily chart too.

Trend is down to 1hr chart, 4hr however remains up until a downside break of 6236 (last HL) puts it in doubt.

G/L

2s9yhag.gif
 
Last edited:
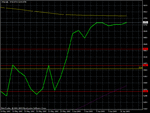
gbpusd

1hr chart is below in respect of prevvious near term imbalances of supp/dem and dem/supp represented as obvious prev sw hi/lo zones on that t/f. Fibs are shown from obvious swing lows 5797 and above up to 6620 and the dotted fib is 6620-current intraday low. Dark Grey shaded area is a previous swing lo zone that is now breeched to the downside and ordinarily I would remove it but it's such an obvious potential sbr zone so have left it on for now.

1hr trend ascending potential support Trend lines have been breeched whichever way you draw them. Price has made a 270 pip down move so far today against a 290 current average daily range.

G/L

qyscc1.gif
 
EUR USD Short

Hi Chris,

I personally look at each level on the way down and if the price action seems to show a reversal is imminent, I play it. So, for example, if we made a pin on the hourly right here, I would probably look to go long rather than stubbornly playing for a "bigger" target to the downside.

It just depends on the type of trader you are. I know one trader that is short Euro/Usd and is looking for parity (lol) and is sitting tight with his position through every move it makes to the upside. Swear down.

Thanks Tom, I have taken an executive decision to close this EURUSD Short on the basis of some strong rejection of 1.3950 on the 30 minute chart. It is looking a better and better long trade on the hourly and 30min chart now. Oh well, you lose some, you lose some more!!! I can always scale back into this one next week whenever a reversal tops out. Trouble is, it is an expensive process finding those tops to short from... I still managed to make 115 pips x 2 out of this trade, which is not too bad, and has wound me up in profit for this week now. The trouble with living in Oz is that now that I have to head to bed, NY is just opening up and the bigger moves happen. Bye for now, and happy trading- it's midnight here and been a long week. The corn long doesn't look good - mine will probably stop out.

Regards Chris
 
Closed 2/3 of this Euro short here at 1.3939.

Final third running with stop at 1.4019.

Looking for 1.3855 for last third.
 
and now it's uncoiling down... :eek:

Yeah it's cr*pped out.

Along with silver. Got stopped out on that one but position was really small as I've never traded Silver before and not familiar with it.

Got out of my final third on the Euro where my trailing stop was at hit at 1.3999.

Ended the day up £160 after the silver debacle. LOL. Oh well...
 
I can't get out because I bought an ETC and have to wait for the opening of the market next monday to negotiate it. I can always hope it's a fake down over the week-end :(
But we know that hope means beginning of the end...
 
Flat EP, YM

How do you guys read the almost flat index charts does this mean indecision?
 

Attachments

  • ep flat.gif
    ep flat.gif
    15.5 KB · Views: 213
  • dow flat.gif
    dow flat.gif
    15.3 KB · Views: 200
Yeah it's cr*pped out.

Along with silver. Got stopped out on that one but position was really small as I've never traded Silver before and not familiar with it.

Got out of my final third on the Euro where my trailing stop was at hit at 1.3999.

Ended the day up £160 after the silver debacle. LOL. Oh well...

That's pretty good Trader_Dante... if I was making that I'd be more than happy :p.

By the way, I think the GBP/USD will penetrate the now resistance level which I put at 1.67060. No idea when, but I am looking for it to penetrate, then retrace back onto it as support at which point I will buy... good idea? I'm only a newbie... :rolleyes:
 
Gbp/chf 4hr

Any one watching GBP/CHF 4hrly? Any comments on this pin bar with a long nose protruding the resistance area strongly.
 

Attachments

  • gbp chf.gif
    gbp chf.gif
    18.1 KB · Views: 211
Any one watching GBP/CHF 4hrly? Any comments on this pin bar with a long nose protruding the resistance area strongly.

Hello,

In looking at your chart, that is a nice pin bar but I think that you would need to be mindful of the support line you have drawn underneath which would be very close to your entry. Correct me if I am wrong but the setup might not be considered A-one due to this potential pivot zone...don't take my word for it though as I am still in the learning process of this type of PA setups in the MMT thread. Perhaps the pin-king could enlighten....

Regards,

Ivor

Although it is a beautiful looking PB but yes, I agree with you and thats why my entry will be below 1.7700 because there is a congestion at the area and more over this trade is against intermediate uptrend on dailies.
 
wtf is that 20:00 bar on the dow all about? just got stopped out for 1 point profit. 10 lamberts for me. anyway erm yeh I'm convinced this is about to destroy itself and for that little H&S to open up for a good 90odd points. what you guys think?
 
wtf is that 20:00 bar on the dow all about? just got stopped out for 1 point profit. 10 lamberts for me. anyway erm yeh I'm convinced this is about to destroy itself and for that little H&S to open up for a good 90odd points. what you guys think?

Dow is 9000!
 
I can't tell you much but I can tell you that he uses the ladder. NOT THE CHARTS.

He only uses the charts to get the key levels and seems to almost never look at it. It's all done watching the price and the size traded at it.

t d thanks for reply
 
Trader_dante...
To trade the Dow Jones do you recommend the Mini-Dow or the E-mini dow... Just a bit confused, cheers dude x
 
Status
Not open for further replies.
Top