Best Thread Potential setups

Status
Not open for further replies.
Gbpusd

You can see the hidden divergence in the 5min that set-up at that 38.2% [5866] of the current intraday fall 5979-5796, following the recovery off current 5796 lows. the 5min set-up came at H not an immediate LH but 30min (next higher t/f into whose trend the set-up indicated a re-entry aftyer the pullback) was at an immediate LH. a LH/LH is the optimum position in this regard for a re-entry to trend, but a H/LH is often observed. A HH/LH would be give more cause for concern.


Just noticing below current price, Weekly S1 and Monthly Pivot are around the same place 5706-14.

G/L

291kwo2.gif
 
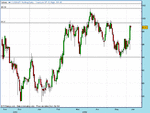
Usd/Jpy :- Poss short at prev Res & retest of right shoulder of H&S @ 99.30 zone.

Stop above the head. RR 2:1. Target bottom of channel/Supp & prev pivot @ 94.00.
 

Attachments

  • img_12444596464156.gif
    img_12444596464156.gif
    18.8 KB · Views: 182
gbpusd

Cable developed into a 5min uptrend, with an effective HL then developing on 15 and 30min. The 5min chart below shows the point at which the 5min downtrend became in doubt...a candle close above the red line signifying a close above the last LH of it's downtrend, following a HL, a pullback off the first H creating the 15 and 30min HL too.

Plentry of demand then at that previously detailed 4hr previous swing lo=previous support (imbalance of demand/supply) = potential support with the trend line (?) and fib confluence.

Doji close (inside bar) on 1hr at this 4hr zone (next higher t/f) was thhe 1hr trigger for entry.

G/L

se2ao0.gif

25rp45e.gif
 
Just closed Aussie long off 0.7820 area. Quick scalp. 20 pips. I know, shame on me.

I'm holding Euro/Usd long. 1.3820 is a good level.
 
gbpusd

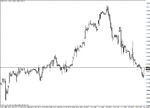
The 1hr downtrend is good until point a is broken to the upside, ie the last LH of that downtrend, ...price is currently finding some resistance at the last minor swing lo that gave rise to the minor swing hi at point a.... the supply also coinciding with the 76.4% of the intraday fall. Should the LH be exceeded to the upside , the downtrend becomes less certain on this t/f although it is still there on the 4hr probably until it's last LH (shown as point b on this 1hr pic below) is breeched to the upside too.

G/L

2s0jyht.gif
 
The 1hr downtrend is good until point a is broken to the upside, ie the last LH of that downtrend, ...price is currently finding some resistance at the last minor swing lo that gave rise to the minor swing hi at point a.... the supply also coinciding with the 76.4% of the intraday fall. Should the LH be exceeded to the upside , the downtrend becomes less certain on this t/f although it is still there on the 4hr probably until it's last LH (shown as point b on this 1hr pic below) is breeched to the upside too.

bbmac, I would like to add something to your insightful posts.

This 1hr pin that is now forming is, in my opinion, the kind of trade that a lot of newbies get caught in.

Now don't get me wrong - it might be a beauty. It comes at a good s/r pivot and people will be quick to point out that it goes with the hourly trend well. (see chart 1)

My problem with it is for it to work well, we need to print another red candle on the daily. When I look at the daily, I think the odds of that happening are diminishing after the recent sharp fall. (chart 2) It seems to me on this TF, like shorts have missed the boat until a retracement upwards has begun on this TF.

I would expect an attempt back to the upside. I see, in my minds eye, a doji or a hammer printed on the daily today.

I'm not trying to act like I've got a crystal ball, I'm just explaining why I can't take this trade. It just doesn't feel right to me.
 

Attachments

  • gbp.gif
    gbp.gif
    23.6 KB · Views: 256
  • gbp2.gif
    gbp2.gif
    23.8 KB · Views: 249
Last edited:
As an addition to the last post, it may not end as an hourly pin but the reasoning would be the same for those situations that are the same i.e. if it had ended that way.
 
Tom,

I have to agree with your reasoning, particularly as the 15min and 30min (arguably 1hr) printed an obvuious HL on the run up from the current 5796 intraday low and lowest point of the downtrend so far. Effectively at the point of the 76.4% fib of the intraday down move t/f's to 15min if not 30min were effectively in an uptrend. I would also only take a 1hr pin (or other clear reversal candle) at a 4hr potential sbr/rbs into whose time frame a re-entry to trend after a pullback was indicated....this was only a 1hr zone.

As you suggested in the end it (1hr) didn't form into a reversal candle at the close. On my chosen t/f's I effectively had a 1min and 5min reversal with a 15min hidden divergence re-entry at a 1hr potential sbr zone that saw some +20pips gain off the 1min trigger, but for the reasons I alluded to in a previous post today the set-ups came at a HH on the 15min (on whose t/f the hidden div set-up developed) after 2 x HL , although at a LH(argubaly after a HL) on 1hr so not the optimum immediate LH/LH into a downtrend that historically has the greatest chance of a with trend follow thru from that point.

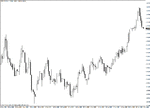
The 15min is shown below and price makes a new HH but still within that 1hr potential sbr zone, albeit minor...23.6% of the 6436-5796 as well as the 38.2% of the 6241-5796 fall resides in that previous minor swing lo zone on 1hr.

Thanks for further insight re a longer t/f perspective

35c1i5y.gif


bbmac, I would like to add something to your insightful posts.

This 1hr pin that is now forming is, in my opinion, the kind of trade that a lot of newbies get caught in.

Now don't get me wrong - it might be a beauty. It comes at a good s/r pivot and people will be quick to point out that it goes with the hourly trend well. (see chart 1)

My problem with it is for it to work well, we need to print another red candle on the daily. When I look at the daily, I think the odds of that happening are diminishing after the recent sharp fall. (chart 2) It seems to me on this TF, like shorts have missed the boat until a retracement upwards has begun on this TF.

I would expect an attempt back to the upside. I see, in my minds eye, a doji or a hammer printed on the daily today.

I'm not trying to act like I've got a crystal ball, I'm just explaining why I can't take this trade. It just doesn't feel right to me.
 
I'm out the S&P at 928. Was short at 935.5.

Christ on a bike CMC quote it at 0.1 so I had 10X my normal size on. lol

Well, that solves last nights query Genics.

I still think that might turd but from a risk perspective, I had to be out of that one at support.
 
I'm out the S&P at 928. Was short at 935.5.

Christ on a bike CMC quote it at 0.1 so I had 10X my normal size on. lol

Well, that solves last nights query Genics.

I still think that might turd but from a risk perspective, I had to be out of that one at support.

I thought you had more conviction than balls dante. Now you're just a shell to me.
 
A nice break to new highs (above 957) coming for the S&P tomorrow.

Easy money? cough cough

Sorry, must stop saying that..
 
Yeah I agree Candles - some days or some periods, the market is completely predictable and very easy to trade above and beyond the normal expectancy of your strategy. The real trick is staying out or risking a low amount when it's not.

I've seen this pattern (daily shooting star triggered and then closing positive the other way) many times and it almost always ends in disaster for shorts.
 
Status
Not open for further replies.
Top