Best Thread Potential setups

Status
Not open for further replies.
Cable short

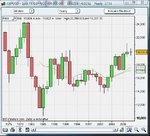
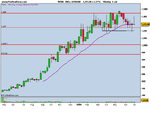
Hey guys I accidently clicked on the yearly cable chart and spotted a good looking pin from last year. If it drops below 19000 I'm going short with a 2000 pip stop loss :LOL:

Not sure about S/R pivots but I see some support in 1978 :cheesy:

....


sorry i was bored
:)
 

Attachments

  • Cable_Yearly.JPG
    Cable_Yearly.JPG
    68.4 KB · Views: 197
That looks more like a doji to me, but if you rolled the last three bars into one it would make a good looking pin, is that what you meant ? Bit of support further <---- that way on the chart and its about 61.8 of the most recent up move.... Ide pass myself as its a bit cluttered around this area and its Friday, also round number 1.61 running right across the top of the pin. Taking my recent track record into account however, this might be an excellent reason for you to get on it :)
 
Superspurs - Have you seen BHP Billiton on the daily?

I see an s/r pivot, a TL and a key fib from the last major swing low.
 
hi T_D ,i cant get much data on my chart but is this the s/r pivot you talked about??
my charts also show bullish divergence if it means anything to you!!??
 

Attachments

  • update.gif
    update.gif
    18.8 KB · Views: 192
thx for that td,i did see it on my flick thru the charts but it didn,t stand out to me,probably because of the previous candle,WSM is what im watching this week,it topped with a bearish OB and has had a retrecement to the 61 fib.weekly charts are so reliable,look at GNS a few weeks ago,i might also have a go at VTG short,that was a great post yesterday td
 

Attachments

  • GENUS.png
    GENUS.png
    10.5 KB · Views: 154
  • VT GROUP 1.png
    VT GROUP 1.png
    11.7 KB · Views: 178
  • WELLSTREAM.png
    WELLSTREAM.png
    9.1 KB · Views: 170
  • BHP BILLITON.png
    BHP BILLITON.png
    10.6 KB · Views: 197
regarding the BHP chart doesnt this look like a h+s break??
 

Attachments

  • update.gif
    update.gif
    10.3 KB · Views: 148
hi jonj,i reckon that the line you have drawn is short term support (which has been broken) but i think this is what td is looking at.funny how different data suppliers give different views.back to back pins just like us/yen last week.ps i forgot the trendline
 

Attachments

  • blt1.gif
    blt1.gif
    22.6 KB · Views: 156
Last edited:
ahahh thanx super,i cant get that far back on my chart!!was wondering bout the fibs also :)
EDIT p.s. thanx anyway ,managed to scalp .45 on from the gap ret !lol
 
seems make or brake time for gold??any views anyone??this is not something i follow much(y)
 

Attachments

  • update2.gif
    update2.gif
    15 KB · Views: 152
  • update.gif
    update.gif
    16 KB · Views: 164
  • update3.gif
    update3.gif
    15.6 KB · Views: 149
similar set up on the eu/us,shorter tf
the us/c looks good with an ib on 4h also and the us/yen trying to move north again,looks like we should get ready for something!!
p.s good luck looks good to me :)
 

Attachments

  • update.gif
    update.gif
    13.9 KB · Views: 149
  • update2.gif
    update2.gif
    15.2 KB · Views: 160
i notice nothing latley here on the e/u or u/j or even gb/u!!?? been great trading lately
 
certainly seems to be a lot of instruments at intersting levels. still papertrading, caught that daily pin on usd/yen spurs was talkin bout. anyone watching the FTSE, close to its march lows, very close to its january. heard someone here (maybe T_D) talk about consecutive lower range bars, is this what we are seeing here?
 

Attachments

  • ftse daily.gif
    ftse daily.gif
    53.5 KB · Views: 189
hi NT im back!,i agree,good point.
from my veiw though im finding it very hard to be bullish on this pair,i think the uptrend has at least for now come to an end?? on my chart the pair has recently broke a strong r/s level and has been (briefly i hope hehe)halted by the suport you have indicated and could well proove stong enough to reverse the price but i think it still has a way to go yet though(just mo)and has another strong level of suport around 197.60 which could be its next level.

EDIT: bare in mind i only demo trade!!
p.s. out for +14

remember this! time for some ret??
 

Attachments

  • update.gif
    update.gif
    16.2 KB · Views: 181
remember this!?? looks interesting again??
 

Attachments

  • update.gif
    update.gif
    17.5 KB · Views: 199
What do you reckon to this daily usdchf chart? MA is 50. On the hourlies its a head and shoulders with a double top on the head.
 

Attachments

  • usdchf_d1.gif
    usdchf_d1.gif
    14.2 KB · Views: 186
Seems to have bounced off the MA 200 and then back off the MA89. A break down from the 200 looks a good entry for me. Nice spot.
 
Status
Not open for further replies.
Top