You are using an out of date browser. It may not display this or other websites correctly.
You should upgrade or use an alternative browser.
You should upgrade or use an alternative browser.
Best Thread Potential setups
- Thread starter trader_dante
- Start date
- Watchers 274
- Status
- Not open for further replies.
N Rothschild
Legendary member
- Messages
- 5,296
- Likes
- 603
its known as ELVS
extremly large ****** syndrome (hubert senters)
extremly large ****** syndrome (hubert senters)
Anyone here suffer frozen finger syndrome? Spotted good trade on daily Aud/Cad last night but failed to pull trigger - up 100 pts today! How do you handle this?
AUD/CAD? I spotted a good short on USD/CAD and have been in and out of it playing my short bias.
I dont get frozen finger syndrome, because I trade at baby stakes, lol. You probably need to slightly reduce your own size, if you are experiencing that problem. Good luck
Attachments
trader_dante
Veteren member
- Messages
- 4,535
- Likes
- 1,704
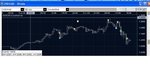
We’ve got an inside bar developing on GBP/USD daily which is right at a significant s/r pivot level.
Now, normally we sell AWAY from resistance but this is what I call a "pressure" trade.
Why do I call it that? Because when I look at the chart I feel that the market is putting pressure on this level by retracing from it initially and then trading right back into it. To my mind, the market wants to take it out.
So, I think this could be in for a move higher with a profit target of 1.4850 (descending TL) then 1.5250 (daily s/r pivot) and 1.5520 (another daily s/r pivot).
Entry would be at 1.4485 with stops for aggressive traders of this strategy at 1.4325 (160 pips) which is hourly support or conservative traders at 1.4152 (333 pips) which is the low of the inside bar.
Big stops on this one but the potential reward if the first target is hit is 365 pips which makes it just over a 1:1 in terms of risk:reward if played conservatively or a 2.3:1 if played aggressively.
Not the best setup ever to grace this thread in terms of R:R but I do feel it's going up so I've put it out there for your perusal 😉
Attachments
Last edited:
Hey TD
Have been having a look at this as I noticed that todays high and yesterdays high are almost identical depending on which feed you look at. My charts show yesterdays high was actually made on Sunday night but don't think that matters.
What put me off initially was my charts (IG) show a high late on Friday of 14540 but this looks incorrect compared to my NorthFinance feed. If I was to believe the IG charts then I would have wanted to see the price break above this high first so your post has got me interested again.
I guess a safer way to trade this could be to wait for a retest of the break but considering that we also have a Two Bar High i have a feeling the break will be stronger.
Just to be sure does anybody else see a high on Friday above 14500 on any other feeds?
Last edited:
tenrocket77
Newbie
- Messages
- 5
- Likes
- 0
I wanted to start this thread as a place to examine the high probability reversal or continuation points in different markets so that traders can look for confirmation in the price action.
I firmly believe that by being patient and waiting for the market to come to you and then only entering the market at these pivots a trader will put the odds significantly in their favour.
Here is one that I have been watching closely for several days now.
first take the emotion out of your movements, then you will move like the market:-0
I shorted cable last night for a few points profit. I shorted it seconds Before I saw TraderDante's post about the possibility of a rally, so I didn'y hold much confidence, but ive been involved in trading long enough to know that untilmately its your own view that you trade. I took a screen shot at my point of entry. the reason for the trade was that we hit an obvious resistance point on my chart. Top of the channel and bounce down a little. We then formed an inside bar (with the red line though it) after this I was waiting for weakness to appear and when it did I shorted it. (I took 50 points out of it)
Attachments
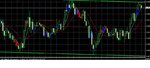
I shorted cable last night for a few points profit. I shorted it seconds Before I saw TraderDante's post about the possibility of a rally, so I didn'y hold much confidence, but ive been involved in trading long enough to know that untilmately its your own view that you trade. I took a screen shot at my point of entry. the reason for the trade was that we hit an obvious resistance point on my chart. Top of the channel and bounce down a little. We then formed an inside bar (with the red line though it) after this I was waiting for weakness to appear and when it did I shorted it. (I took 50 points out of it)
Candles
Nice one on your 50 pts. As a newbie to FTse trading how do you spot 'weakness' on your charts of the FTSE?😕
trader_dante
Veteren member
- Messages
- 4,535
- Likes
- 1,704
Looking for the Dow to hit 7900.
Currently trading at 7990.
Currently trading at 7990.
trader_dante
Veteren member
- Messages
- 4,535
- Likes
- 1,704
Best place to hit it would be 8050 or if it dips back below 8000.
bbmac
Veteren member
- Messages
- 3,584
- Likes
- 789
Rangy old day on Gbpusd pairing so far this london/European morning..5min to 1hr with plays on the lower t/f's.

Screenshot shows the area of Friday's (and last week's) Hi (circled in red) and the decsending resistance t/lines on the 1hr chart (both un-tested as yet) as well as the most immediate near term area of previous suppport with areas circled in green.
Aggressive breakout plays may be a break of that support or the res t/lines?
G/L
I went against the crowd in the DOW thread yesterday and won with my long bias 🙂
I have now switched for the short term and am also looking for some downside from here. Lets see.
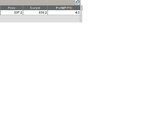
Am closing 1/3 of my position here for 40 pips profit (spx)
Attachments
grimweasel
Well-known member
- Messages
- 488
- Likes
- 108
grimweasel
Well-known member
- Messages
- 488
- Likes
- 108
Gold seems to be winding up for a big move - the ma's are all together and it's getting squeezed. Was the recent dip a bull flag??
Gold seems to be winding up for a big move - the ma's are all together and it's getting squeezed. Was the recent dip a bull flag??
i`m currently long on gold at 903, :whistling
trader_dante
Veteren member
- Messages
- 4,535
- Likes
- 1,704
wtf is the Dow doing up here LOL
don't be silly...
don't be silly...
grimweasel
Well-known member
- Messages
- 488
- Likes
- 108
wtf is the Dow doing up here LOL
don't be silly...
And the FTSE! The yen has been selling off today with the rise in indicies I guess?
firewalker99
Legendary member
- Messages
- 6,655
- Likes
- 613
wtf is the Dow doing up here LOL
don't be silly...
You been very bearish for last week t_d...
Chart tells a different story though... we broke support, but immediately came back up and after that we broke the trendline down...
There was too much consensus around that we would see new lows last week. Market always does what's least expected.
Attachments
- Status
- Not open for further replies.
Similar threads
- Replies
- 2
- Views
- 8K