Best Thread Potential setups

Status
Not open for further replies.
gona stick my neck out and get shot down.

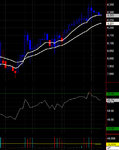
this rally is short covering :devilish:

hmm...doubtful... it misses something
for example the agressiveness of that upmove isn't particularly vigorous compared to most short-covering rallies

but we'll see :)
 
S and P 500 Index - (SPX)

Open Interest

Call 4,388,346

Put 6,143,471

from cboe

Before the open 2morow :

Core Durable Goods Orders m/m

Unemployment Claims

Ford, Continental airlines, and US airlines
 
Last edited:
remember these are last Tuesdays positions, always love to see the difference between commercial and retail positions..says it all!
 
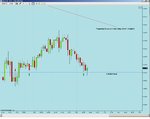
2hr chart, totaly overbought i dont see this going higher without a retracement. nikkei is also heading down nicely. i expect we shall see 8200...
 

Attachments

  • ss2.jpg
    ss2.jpg
    56.2 KB · Views: 166
GBP/USD Mar09

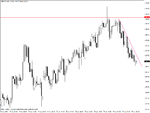
Looking for the upside breakout of the short-term trendline on the hourly.

07:00am: bearish breakdown below 1.4100
 

Attachments

  • GBP.Springboard.jpg
    GBP.Springboard.jpg
    66.1 KB · Views: 166
Last edited:
Hi,

Have heard COT being mentioned in various places... how significant and helpful is this
for traders? Do you think big trading firms or prop shops have specialists reading this type
of data?

Cheers

Hi Chill,

In terms of significance it tells you how traders are placed (long, short) in a particular market and can be used to judge extremes in sentiment. I think the helpfulness of the COT report depends on the trader and their style.

I am not sure about big trading firms but as far as I know prop houses don't have specialists reading this kind of data. Two reasons for that:

a) We all do our own thing
b) It is relatively easy to read and understand yourself if you know what you are looking for. There is lots of free help on the web about it

I personally don't rely on it but look at it from time to time.
 
one way i use it is to go through and find glaring examples of non commercial positions being like 2:1 long when commercial is 2:1 short etc. as they say 90% of traders loose money so its usually a pritty safe bet to do the opposite of what any non commercial positions are doing lol. its only really useful on a swing basis on markets that say haven't broken out yet. It is released every friday but it contains Tuesdays data so your a few days behind.

At the moment COT and CBOE open intrest is telling me there is alot of short positions in the market, one of the reasons i dont believe we are going to rally (for a few days atleast)

All just comes down to your personal interpretation of the data
 
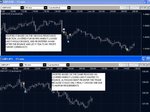
Just a question, but why you would want to wait 4 hours if you could've already entered around 129.10? There was clearly a rejection of some sort and the resistance from the second week of January around this level could make life difficult for those holding long positions. But that R is there on each timeframe and each bar interval. The advantage of entering early is a very tight stop, and by now it could already be break-even...

And those who did take that entry (on a smaller bar interval), are sitting on a very nice profit at the moment...
 

Attachments

  • gbpjpy.gif
    gbpjpy.gif
    21 KB · Views: 181
Good points raised by TD and Genics.

Similarly, I think it depends on what your style is and which contracts you are trading. Combined with open interest and a good idea of what the "hot topics" are in the marketplace, it can be an interesting read... but I wouldn't reject a trade or put positions solely on it... like they used to say on the big breakfast "Don't phone (your broker) it's just for fun!".
 
The "by now it could already be break-even" part of the quote bothers me though...

If you zoom in to the smaller interval, the worst case entry was at 129.10. The further you step back the longer you wait and the worse entry you get. Worse entry means more risk. If you entered off 129.10 or higher and you see price falling to 128 why would you risk a profit turning into a loss?
 
If you zoom in to the smaller interval, the worst case entry was at 129.10. The further you step back the longer you wait and the worse entry you get. Worse entry means more risk. If you entered off 129.10 or higher and you see price falling to 128 why would you risk a profit turning into a loss?

I was wondering whether it meant a trailed stop to break-even, purely on a monetary basis.

On the basis that the market doesn't respect where you entered, doesn't it make sense to take the approach of always having the stop in a technical position?

Surley it's better to have a 30% chance of losing 0.5 if it rises again, rather than a 100% chance of being breakeven?

It's a good exercise to pick a random hourly candle, and toss a coin for long or short, and then work out the best place for a protective stop. (Or shorter timeframes if you can handle them -I can't).
 
Last edited:
I was wondering whether it meant a trailed stop to break-even, purely on a monetary basis.

On the basis that the market doesn't respect where you entered, doesn't it make sense to take the approach of always having the stop in a technical position?

Surley it's better to have a 30% chance of losing 0.5 if it rises again, rather than a 100% chance of being breakeven?

Have to agree with Joey here. Technical stops are always the best. Too many people rush their stop to break even so that it is a "free" trade which I think is possibly one of the biggest mistakes you can make.

But in defence of FW, since his theoretical entry is so tight, a breakeven stop makes sense because if the market comes all the way back up there, the probability is highely likely the trade will be wrong as the market is not acting "right".

It really depends on your entry. If you enter AT a resistance and the market comes off sharply from it, then a breakeven makes more sense because you wouldn't want to be in if the market comes back there.

If you enter 50 ticks later, after a resistance has been confirmed and the market then continues to come off for a bit, then a breakeven stop makes no sense because going offside (losing money) means nothing. You are not wrong until the resistance is broken.

This is why for scalpers that enter at levels, breakeven is acceptable. For those trading pins, it is a terrible strategy that will almost always result in never realising the big gains.
 
Maybe Point & Figure charting is the way to get round this problem of "clarity vs proficiency of entry" issue with timeframes?

There's a guy who uses them in one of the FTSE threads and there doesn't appear to be any loss of information.
 
Status
Not open for further replies.
Top