You are using an out of date browser. It may not display this or other websites correctly.
You should upgrade or use an alternative browser.
You should upgrade or use an alternative browser.
BT
I had too many signals on the 1min charts and I'm not really a scalper so I was getting lots of action I couldn't handle.
I moved out to 2mins and things got better - Joe said check out 5-10 min charts in post 13 above.
10min was just way too slow for me. 5 minute gives me the main reversal signals of the day - usually 4-6 signals. Plus some nice candles at key points too.
Today the nos of signals was an exception because there were two continuation signals that I couldn't rely upon on 1-2 min charts.
Cheers
Well 7 hours sleep and following my simple exit signals paid off in Siming terms in the morning session – the afternoon was patchy to say the least.
I’m still getting use to the 5min candle printing – need to concentrate on not surfing in gaps etc. I’ve got a better ‘simple exit method’ that should keep me in two thirds of a move and stop me bailing out too early. It was a shame that there was no signal on the slide down from the open…..but that’s real nit-picking.
I think a shorter lunch period next week too…because I missed signal S5 and with 5min charts the signals don’t come along too often.
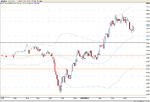
S1 – nice entry 650.1 (15:01) – exit signal got me out at 652.20 which was pretty good
S2 – great entry signal at 651.6 (15:49) – I almost bailed a couple of times – then closed at exactly 2pts (653.6) – my exit signal was 1.1 pts higher !!
S3 – entry at 654.1 (16:49) – good exit at 654.7
S4 – didn’t take - Lunch
S5 – didn’t take – still at Lunch (back at 6:30 – but too late for any of those pts)
S6 – didn’t take – family crisis – my daughters hamster has disappeared !!
Back to Live trading 1 contract on Monday.
Entries – three nice ones am – a few misses pm
Exits – mostly good – need to trust exit signal a bit more S2 was 1.1 pts early
Points today +4.7pts (not including comms) – but this is just to get my timing right with 5min charts – next week is live….
Onwards and upwards……….
I’m still getting use to the 5min candle printing – need to concentrate on not surfing in gaps etc. I’ve got a better ‘simple exit method’ that should keep me in two thirds of a move and stop me bailing out too early. It was a shame that there was no signal on the slide down from the open…..but that’s real nit-picking.
I think a shorter lunch period next week too…because I missed signal S5 and with 5min charts the signals don’t come along too often.
S1 – nice entry 650.1 (15:01) – exit signal got me out at 652.20 which was pretty good
S2 – great entry signal at 651.6 (15:49) – I almost bailed a couple of times – then closed at exactly 2pts (653.6) – my exit signal was 1.1 pts higher !!
S3 – entry at 654.1 (16:49) – good exit at 654.7
S4 – didn’t take - Lunch
S5 – didn’t take – still at Lunch (back at 6:30 – but too late for any of those pts)
S6 – didn’t take – family crisis – my daughters hamster has disappeared !!
Back to Live trading 1 contract on Monday.
Entries – three nice ones am – a few misses pm
Exits – mostly good – need to trust exit signal a bit more S2 was 1.1 pts early
Points today +4.7pts (not including comms) – but this is just to get my timing right with 5min charts – next week is live….
Onwards and upwards……….
Attachments
Im sorry to sound not very optimistic, I though you was trading live. It will be totally different, when going Live I will guarantee it. Things dont go to plan when live. been there done it.
Let me know next week how you got off.only trade 1 lot. Also you use 5 min charts. Take a look at 4 min charts. To many look at 5 min.
good luck
BT
Let me know next week how you got off.only trade 1 lot. Also you use 5 min charts. Take a look at 4 min charts. To many look at 5 min.
good luck
BT
Well I usually start the week a bit slowly and today was no different……felt positive before the open….but made three basic violations of my trading rules and therefore had $310 worth of lessons (losses and opportunity losses)……...at least I feel I’ve had value for money and I am still strangely positive about it 😆
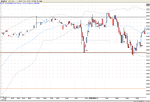
S1(L) – great signal - failed to take – my bias was still short even though all my indicators (bar one) said high probability bounce long off 659.70
Non-Signal - entry 662.7 (15:21) – stopped out at 663.7 – made the fatal mistake of taking a signal after 1min of a 5min candle – of course the signal was not valid by the end of the candle printing – there is a good $105 lesson if ever there was one.
S2 (L) – continuation signal – entry 664 (15:41) and closed at 664.6 after exit signal
S3 (L) - entry 664 (16:22) – closed at 663.8 – as I entered the oil price went back up to test $64 – I decided to exit if it made a concerted break above the 64 level – this is not an exit signal - I just decided that my edge was now an oil price lottery.
Well another lesson this time only $185 (-0.3pts for the close, $5 comms & missing the 1.5pt break). I had held to -0.9pts on my position, but when the oil price rose above $64, ER2 held up pretty well and then broke out nicely….. I must not look at QM chart!!
S4(L) – signal - failed to take – researching on 15 min charts !!
Non-Signal - entry 661.2 (19:35) – stopped out at 660.2 – made the mistake of taking a signal with only one indicator confirmation rather than the required 2. The result was well deserved…….
S5(L) – nice continuation signal - failed to take
Why 5 long signals and no short signals – well I had a partial sell signal at 18:00 but didn’t have the second confirming indicator (but it was close). Funnily there were crystal clear sell signals at 17:10 and 18:00 on the ES & YM !!
Entries – two ok ones – three misses – two non-signals
Exits – one good one – one exit on non-signal – two stop outs
Points today -1.6pts (not including comms)
Onwards and upwards……….
Attachments
My new freelance contract means I’m going to miss the morning sessions between Tuesdays and Thursdays (very painful but the money is just too good to turn down). So 2:30 UK time was quite frustrating today wondering how things opened. But I’m in for the long haul so I think this a necessary short term compromise……plus I need to get better at the afternoon sessions.
More lessons today (with S5) in probabilities and wanting absolute precision before entry…..and a gap in entry rules in my trading plan (S7).
The main positive from today is this is the kind of day when the signals really shine – S1, S5 and S7 alone were a weeks target for me if played half decently.
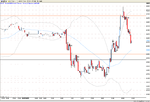
S1(S) – nice signal - failed to take – at work
S2(S) – failed to take – at work
S3(L) – failed to take – at work
S4 (L) - entry 658.4 (17:40) – stopped at 658 – moved 0.7 into profit – I tightened SL from 1pt to 0.4pt – the price limped back to stop.
S5(L) – great signal – in the same series as S3 & S4 - failed to take – because I wanted perfection – it was 0.2pts out of alignment with the prior low so I didn’t take it – even with the 0.2pt differential it was still a 70-75% solid signal.
S6(S) – so after being very picky with S5 - I then jump straight into a counter trend PB – entry 661.30 (19:16) and close at 660.40 when I get S7 signal formed.
S7(L) – a strong continuation signal confirmed by two indicators – but the 5min candle had just started printing at 19:25 so I left it – I could have probably got in at around 660.60 - it then went up painfully high. At least I followed my trading plan rules.
I think the rule on waiting for the 5min candle to print is clearly mandatory for a reversal signal, however for a continuation signal I thinking an entry with trend during the candle print is acceptable. Any views on this? I will update my trading plan because it just says wait for 5min candle to print – with no clarification on signal type.
Felt a bit emotionally steamrollered after S7 - so I left the last hour because I wasn’t thinking clearly. Therefore missed the S8 signal.
Entries – two ok ones – two real biggies missed for interesting reasons – no non-signals
Exits – one good one – one exit on reduced stop – no stop outs
Points today +0.5pts (not including comms)
Onwards and upwards……….as S5 & S7 should have been dohhhhh !!
More lessons today (with S5) in probabilities and wanting absolute precision before entry…..and a gap in entry rules in my trading plan (S7).
The main positive from today is this is the kind of day when the signals really shine – S1, S5 and S7 alone were a weeks target for me if played half decently.
S1(S) – nice signal - failed to take – at work
S2(S) – failed to take – at work
S3(L) – failed to take – at work
S4 (L) - entry 658.4 (17:40) – stopped at 658 – moved 0.7 into profit – I tightened SL from 1pt to 0.4pt – the price limped back to stop.
S5(L) – great signal – in the same series as S3 & S4 - failed to take – because I wanted perfection – it was 0.2pts out of alignment with the prior low so I didn’t take it – even with the 0.2pt differential it was still a 70-75% solid signal.
S6(S) – so after being very picky with S5 - I then jump straight into a counter trend PB – entry 661.30 (19:16) and close at 660.40 when I get S7 signal formed.
S7(L) – a strong continuation signal confirmed by two indicators – but the 5min candle had just started printing at 19:25 so I left it – I could have probably got in at around 660.60 - it then went up painfully high. At least I followed my trading plan rules.
I think the rule on waiting for the 5min candle to print is clearly mandatory for a reversal signal, however for a continuation signal I thinking an entry with trend during the candle print is acceptable. Any views on this? I will update my trading plan because it just says wait for 5min candle to print – with no clarification on signal type.
Felt a bit emotionally steamrollered after S7 - so I left the last hour because I wasn’t thinking clearly. Therefore missed the S8 signal.
Entries – two ok ones – two real biggies missed for interesting reasons – no non-signals
Exits – one good one – one exit on reduced stop – no stop outs
Points today +0.5pts (not including comms)
Onwards and upwards……….as S5 & S7 should have been dohhhhh !!
Attachments
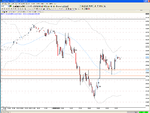
Well yesterday is a distant memory – one nice play….and another nice day for the signals (with the two main reversals S2 and S4)
S1(L) – at work
S2(S) – at work
S3(S) – at work
S4 (L) – nice entry 656.6 (19:10) – closed 660.2 – it moved pretty quickly up through three resistance levels and I exited on a signal too.
S5(S) – failed to take
Entries – only one and a good one – no non-signals
Exits – one good one – no stop outs
Points today +3.6pts (not including comms)
Onwards and upwards……….
Attachments
I dont think you are going to get much response.Because we dont know what you are doing, So you cant get any feed back. Until we now 100% how you place you trades, what I see is a simple method you use. maybe looking at 3 lower lows for long trades,(pull backs) and 3 higher highs for a shorts,,(pull backs) and confirming this with maybe the Nas and YM with a positive candle for longs and negative candle for shorts. Do you have a stop or target in mind and targets.
Hi BT,
The rationale of the journal is all covered in post 1.
I have a 1pt stop and I have no predefined targets. I have exit signals I use to exit my 1 contract.
When I trade multiple contracts in the future I will scale out at predefined levels upto the exit signal level.
Cheers
The rationale of the journal is all covered in post 1.
I have a 1pt stop and I have no predefined targets. I have exit signals I use to exit my 1 contract.
When I trade multiple contracts in the future I will scale out at predefined levels upto the exit signal level.
Cheers
BT,
Maybe we can do this by a process of elimination.....I'll tell you what the signals aren't based on:
1) Any price based indicators
2) Any moving averages
3) Any EW twaddle....btw EWers remind me of intelligent people who smoke...they know its bad for them but they keep doing it anyway......if in doubt there's an alternate count about 🙂
4) I don't use candle definition in my signals - but will be careful where certain ones appear
5) Lower High, Higher Low, 1-2-3 reversal type stuff - although that all makes perfect sense to me.
Cheers
turtle trader
Active member
- Messages
- 172
- Likes
- 6
jessop said:BT,
Maybe we can do this by a process of elimination.....I'll tell you what the signals aren't based on:
1) Any price based indicators
2) Any moving averages
3) Any EW twaddle....btw EWers remind me of intelligent people who smoke...they know its bad for them but they keep doing it anyway......if in doubt there's an alternate count about 🙂
4) I don't use candle definition in my signals - but will be careful where certain ones appear
5) Lower High, Higher Low, 1-2-3 reversal type stuff - although that all makes perfect sense to me.
Cheers
How about trading off support/resistance levels & consolidation breakouts - am I getting warm?
Simon
p.s. very interesting thread - keep it up.
Simon,
I did think about putting R&S down - but that's a tricky one.
I do not take signals based on R&S levels (my orange & black lines) - but they are a key factor in my reading of the signals and the likely strength of the subsequent move.
I have thought about having a set of signals - where there is a breakout/breakdown from one of my R/S levels and one of my other signal types (3 in total) occur.
However, the backtesting results were not high enough probablity for me to add them in.
I'm learning to stick to setups I have 110% confidence in.
Opening signals are sometimes a bit slow - so I occassionly miss a 2-5 point move from the open. This use to really bug me. But now I accept I have a great edge and I have to wait for them to occur and not try and overtrade.
Thanks for the feedback
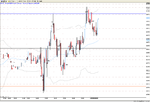
After missing the great rally day yesterday I thought we were in for Whipsaw City today – well it wasn’t quite that bad …..a few interesting plays
I had a hangover which didn’t quite help the focus (even after 2 Red Bulls & 3 coffees).
S1 (S) – nice entry 666 (14:51) – closed 665.3 – in the same 5 min bar when the price didn’t break down as I expected and one of my indicators bounced back to show strength – it was also oversold & testing 665.60 – great exit in hindsight
S2 (L) – failed to take – poor concentration
Non-signal - well it’s a signal on my research list but not in my trading plan. But I was also using oil price as the entry trigger. Entry 669.8 (15:50)– I was really cross I entered on a non-signal so I exited 2 minutes later – closed 670.2 - the fact that it turned into a subsequent 2 pt move doesn’t bother me – but I will put this “non-signal” on the top of my research list now !!
S3 (S) – nice entry 668.3 (16:35) – this looked like a good reversal signal to me – so I was determined to hold it through the first PB and assess it. I couldn’t easily watch the screen as it when -0.5 against. I even walked around the house and did some deep breathing to keep calm and prevent an early exit. Once price started dropping I was better. Once it got to 1pt+ I moved the profit target to 665.60 but a potential exit signal was looming. I then looked at the QM/YM charts and could see the move up and thru $66. I wasn’t sure that it was going to hold and decided to exit at 1.4pts. With this signal I know it is a usually a good sign of weakness and a good hold through the first PB – however, as soon as I pulled up the QM/YM chart my signal turned in my mind to a pure oil price play – closed at 666.9. In hindsight a good exit in terms of points, but I’m not sure for the right reasons!!
S4 (L) – failed to take – 17:15 bar too aggressive & still thinking about S3
S5 (S) – failed to take – at lunch
S6 (L) – failed to take – at lunch
Non-signal – fatigue setting in now – my favourite trick of entering part way through a 5 min candle printing – looked like a continuation signal – then disappeared by final print. At least I got out b/e. Entry 670.9 (19:42) exited 3 minutes later for 670.9
So I stopped at 7:50pm whilst I was still ahead
Entries – two good ones – two non-signals
Exits – two good ones – two non-signal exits - no stop outs
Points today +1.7pts (not including comms)
Onwards and upwards……….
Attachments
Why wont you disclose what you are doing. even if you posted you method in the Wall street paper, Nobody would follow it, Why I ask this,you method is similar to mine where I am getting in and out. On the Russell made 4,8 points based on 1 lot $480,00 and thats after commission is taken out. I am 100% sure you have not got the Holy grail,LOL that you think you have. If you use OIL as a filter over the next few weeks, I feel it will let you down, it is going to lose its hedge.
Hi BT,
The rationale of the journal is still all covered in post 1 🙄
Congratualtions on your 4.8 pts yesterday.
BTW - I have never said I have a system that is the Holy Grail. Its just an edge I am really confident in.
The Holy Grail for this newbie is covered in post 15......
Cheers
The rationale of the journal is still all covered in post 1 🙄
Congratualtions on your 4.8 pts yesterday.
BTW - I have never said I have a system that is the Holy Grail. Its just an edge I am really confident in.
The Holy Grail for this newbie is covered in post 15......
Cheers
fxmarkets
Established member
- Messages
- 834
- Likes
- 50
hello jessop, very open and honest, what do you mean with your signals "Failed" to take ? small point but , I mean are you chosing with control not to take them ? , have you planned to look at all signals and act with discretion when each arises ? Now with your backtesting, what does it reveal in terms of exits and relating that to unit risk against trade expected unit return, overtime?
charliechan
Experienced member
- Messages
- 1,008
- Likes
- 119
badtrader said:Why wont you disclose what you are doing. even if you posted you method in the Wall street paper, Nobody would follow it, Why I ask this,you method is similar to mine where I am getting in and out. On the Russell made 4,8 points based on 1 lot $480,00 and thats after commission is taken out. I am 100% sure you have not got the Holy grail,LOL that you think you have. If you use OIL as a filter over the next few weeks, I feel it will let you down, it is going to lose its hedge.
good point. the setup has the least amount of impact when determining success in trading.
it is really quite irrelevant.
anyway, even if the whole world knew where that entry point is, no one would fade it as there is currently only 1 contract to fade!
commanderco
Well-known member
- Messages
- 363
- Likes
- 7
jessop said:Hi BT,
The rationale of the journal is still all covered in post 1 🙄
Cheers
Jessop, I have just scanned this thread and the impression you leave is that you are plucking up courage to trade with real money.
Point 5 in post # 1 is invalid since you have contributed nothing to the group but I suspect you have gained in some way from your public postings
I do not trade the ER2; I trade CME IMM´s on 5 min charting via Esignal / RefCo.
My method is simplicity itself, I compare the volatility & momentum between the 5 & 10 min charts, using efs 2 this can be done on the 5 min chart.
This is 10% of training in my opinion the other 90% is the interesting part as you know.
Good luck with your approach to trading.
Similar threads
- Replies
- 0
- Views
- 2K