Point and Figure Trading

text11jan100927.png

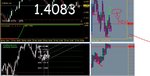
"P&F GOLD5 Box Size $1.50X3 or(0.33%) HI/LO
Data 1384.24 - 1352.72 ~ 0.19 Month ~ 5.83 Day
Database 1050 records 1375.65 (Last Close)
2011-01-05 10~50
2011-01-11 06~40 (GMT+01:00) Paris
BJF Trading Group MDunleavy chart"

1384.50|~15O||__________________________________________________|-0.02%|2.35%
1383.00|~3OO||__o_______________________________________________|0.09%|2.24%
1381.50|~45O||__o_______________________________________________|0.2%|2.13%
1380.00|~6OO||__o_______________________________________________|0.31%|2.02%
1378.50|~75O||==o=x===x===================x===================+=|0.41%|1.91%
1377.00|~9OO||__o_x_o_x_o_____+___________x_o_________________x_|0.52%|1.79%
1375.50|~1O5O|__o_x_o_x_o_x___x_+_________x_o_____x___________x_|0.63%|1.68%
1374.00|~12OO|__o_x_o_x_o_x_o_x_o_+_______x_o_____x_o_x___+___x_|0.74%|1.57%
1372.50|~135O|__o_x_o___o_x_o_x_o___+_____x_o_x___x_o_x_o_x_+_x_|0.85%|1.46%
1371.00|~15OO|__o_x_____o_x_o_x_o_____+___x_o_x_o_x_o_x_o_x_o_x_|0.96%|1.35%
1369.50|~165O|__o_x_____o_x_o_x_o_____x_+_x_o_x_o_x_o_x_o_x_o_x_|1.06%|1.24%
1368.00|~18OO|__o_x_____o___o_x_o_____x_o_x_o_x_o___o_x_o_x_o___|1.17%|1.13%
1366.50|~195O|__o_x_________o_x_o_x___x_o_x_o_______o___o_+_____|1.28%|1.02%
1365.00|~21OO|__o___________o___o_x_o_x_o_________+_____+_______|1.39%|0.91%
1363.50|~225O|__________________o_x_o_x_________+_______________|1.5%|0.8%
1362.00|~24OO|__________________o_x_o_x_______+_________________|1.61%|0.69%
1360.50|~255O|__________________o_x_o_______+___________________|1.72%|0.58%
1359.00|~27OO|__________________o_x_______+_____________________|1.82%|0.46%
1357.50|~285O|__________________o_x_____+_______________________|1.93%|0.35%
1356.00|~3OOO|__________________o_x___+_________________________|2.04%|0.24%
1354.50|~315O|__________________o_x_+___________________________|2.15%|0.13%
1353.00|~33OO|__________________o_+_____________________________|2.26%|0.02%
1351.50|~345O|__________________+_______________________________|2.37%|-0.09%
Column||||||||O_1_9_4_4_7_5_7_7_1_9_4_6_3_9_8_4_3_5_6_5_5_4_3_6_|
Count|||||||||__3_______________5_______________________________|

mane11jan100848.png
view11jan100945.png

BJF Trading Group. Excel Chart. Full size attached.
 

Attachments

  • GOLD11Jan101123.zip
    84.5 KB · Views: 144
Trade Idea: GBP/AUD - Sell ⬇(Stop Limit) at 1.6055; Target: 1.5770 ; Stop: 1.6245.
In the case of failures.
Trade Idea: GBP/AUD - Sell ⬇(Stop Limit) at 1.6340; Target: 1.5770 ; Stop: 1.6530.

"P&F GBPAUD10080 Box Size 500X4 or(8.79%) HI/LO
Data 3.0393 - 1.5138 ~ 240.1 Month ~ 7308 Day
Database 1046 records 1.60434 (Last Close)
~ 20.01 Years
1991-01-06 00~00
2011-01-09 00~00 (GMT+01:00) Paris
BJF Trading Group MDunleavy chart"

3.0500|~5OO||________________________________+_______________________|-0.35%|101.48%
3.0000|~1OOO|________________________+___+___x_+_____________________|1.29%|98.18%
2.9500|~15OO|________________________x_+_x_+_x_o_x___________________|2.94%|94.87%
2.9000|~2OOO|________________________x_o_x_o_x_o_x_o_________________|4.58%|91.57%
2.8500|~25OO|________+___________+___x_o_x_o_x_o_x_o_+_______________|6.23%|88.27%
2.8000|~3OOO|________x_+_________x_+_x_o_x_o_x_o_x_o___+_____________|7.87%|84.96%
2.7500|~35OO|________x_o_+_______x_o_x_o_x_o_x_o_x_o_____+___+_______|9.52%|81.66%
2.7000|~4OOO|________x_o___+_____x_o_x_o_x_o_x_o_x_o_x_____+_x_+_____|11.16%|78.36%
2.6500|~45OO|________x_o_____+___x_o_x_o_x_o_x_o_x_o_x_o_____x_o_+___|12.81%|75.06%
2.6000|~5OOO|+_______x_o_______+_x_o___o_x_o___o_x_o_x_o_____x_o___+_|14.45%|71.75%
2.5500|~55OO|x_+_____x_o_________x_____o_x_____o___o_x_o_x___x_o_____|16.1%|68.45%
2.5000|~6OOO|__o_+___x_o_________x_____o_x_________o_x_o_x_o_x_o_____|17.74%|65.15%
2.4500|~65OO|__o_x_+_x_o_________x_____o_x_________o_x_o_x_o_x_o_____|19.39%|61.84%
2.4000|~7OOO|__o_x_o_x_o_x_______x_____o_x_________o_x_o_x_o_x_o_____|21.03%|58.54%
2.3500|~75OO|__o_x_o_x_o_x_o_____x_____o___________o___o_x_o_x_o_____|22.68%|55.24%
2.3000|~8OOO|__o_x_o_x_o_x_o_____x_______________+_____o_+_o_x_o_____|24.32%|51.94%
2.2500|~85OO|__o_x_o___o_x_o_x___x_____________+_______+___o_x_o_x___|25.97%|48.63%
2.2000|~9OOO|__o_x___+_o_x_o_x_o_x___________+_____________o_x_o_x_o_|27.61%|45.33%
2.1500|~95OO|__o_x_+___o_x_o_x_o_x_________+_______________o_x_o_x_o_|29.26%|42.03%
2.1000|1OOOO|__o_+_____o_x_o_x_o_x_______+_________________o_x_o_x_o_|30.91%|38.72%
2.0500|1O5OO|__+_______o_+_o_x_o_x_____+___________________o_+_o_+_o_|32.55%|35.42%
2.0000|11OOO|__________+___o_+_o_x___+_____________________+___+___o_|34.2%|32.12%
1.9500|115OO|______________+___o_x_+_______________________________o_|35.84%|28.81%
1.9000|12OOO|__________________o_+_________________________________o_|37.49%|25.51%
1.8500|125OO|__________________+___________________________________o_|39.13%|22.21%
1.8000|13OOO|______________________________________________________o_|40.78%|18.91%
1.7500|135OO|______________________________________________________o_|42.42%|15.6%
1.7000|14OOO|______________________________________________________o_|44.07%|12.3%
1.6500|145OO|______________________________________________________o_|45.71%|9%
1.6000|15OOO|______________________________________________________o_|47.36%|5.69%
1.5500|155OO|______________________________________________________o_|49%|2.39%
1.5000|16OOO|______________________________________________________+_|50.65%|-0.91%
Column|||||||1_9_7_4_1_1_7_8_5_7_1_4_7_1_1_7_8_9_8_1_7_8_5_1_1_1_4_1_|
Count||||||||________1_5_________8_____2_2_________2_______O_3_3___4_|

mane11Jan161627.PNG
without11Jan161653.PNG

BJF Trading Group. Excel Chart. Full size attached.
 

Attachments

  • GBPAUD_2011.zip
    7.4 KB · Views: 132
Trade Idea: Usd/Zar - Sell ⬇ (Stop Limit) at 7.00; Target: 6.8750/6.8000 ; Stop: 7.100.
In the case of failures.
Trade Idea: Usd/Zar - Sell ⬇ (Stop Limit) at 7.10; Target: 6.8750/6.8000 ; Stop: 7.1800.

"P&F USDZAR5 Box Size 110X3 or(0.47%) HI/LO
Data 7.134 - 6.7969 ~ 0.3 Month ~ 9.11 Day
Database 2010 records 7.08335 (Last Close)
2011-01-12 14~55
2011-01-21 17~40 (GMT+01:00) Paris
BJF Trading Group MDunleavy chart"
Code:
http://docs.google.com/View?id=dg3m7zmf_126c5nfqcx
7.1280|~11O||______________________________x_+_x_+_____|0.08%|4.87%
7.1170|~22O||______________________________x_o_x_o_+___|0.24%|4.71%
7.1060|~33O||__________________________+___x_o_x_o___+_|0.39%|4.55%
7.0950|~44O||______________________+___x_+_x_o_x_o_x___|0.55%|4.39%
7.0840|~55O||======================x=+=x=o=x=o===o=x=o=|0.7%|4.22%
7.0730|~66O||______________________x_o_x_o_x_____o_x_o_|0.86%|4.06%
7.0620|~77O||______________________x_o_x_o_x_____o___o_|1.01%|3.9%
7.0510|~88O||______________________x_o_x_o_____________|1.16%|3.74%
7.0400|~99O||______________________x_o_________________|1.32%|3.58%
7.0290|~11OO|______________________x___________________|1.47%|3.41%
7.0180|~121O|______________________x___________________|1.63%|3.25%
7.0070|~132O|______________________x___________________|1.78%|3.09%
6.9960|~143O|______________________x___________________|1.93%|2.93%
6.9850|~154O|______________________x___________________|2.09%|2.77%
6.9740|~165O|______+_______________x___________________|2.24%|2.61%
6.9630|~176O|______x_+_____________x_________________+_|2.4%|2.44%
6.9520|~187O|______x_o_x___________x_______________+___|2.55%|2.28%
6.9410|~198O|______x_o_x_o_________x_____________+_____|2.71%|2.12%
6.9300|~2O9O|______x_o_x_o_+___+___x___________+_______|2.86%|1.96%
6.9190|~22OO|______x_o___o___+_x_+_x_________+_________|3.01%|1.8%
6.9080|~231O|______x_____o_____x_o_x_______+___________|3.17%|1.63%
6.8970|~242O|______x_____o_x___x_o_x_____+_____________|3.32%|1.47%
6.8860|~253O|______x_____o_x_o_x_o_x___+_______________|3.48%|1.31%
6.8750|~264O|______x_____o_x_o_x_o_x_+_________________|3.63%|1.15%
6.8640|~275O|______x_____o_x_o_x_o_+___________________|3.78%|0.99%
6.8530|~286O|__+___x_____o___o_x_+_____________________|3.94%|0.83%
6.8420|~297O|__x_+_x_______+_o_+_______________________|4.09%|0.66%
6.8310|~3O8O|o_x_o_x_____+___+_________________________|4.25%|0.5%
6.8200|~319O|o_x_o_x___+_______________________________|4.4%|0.34%
6.8090|~33OO|o_+_o_x_+_________________________________|4.56%|0.18%
6.7980|~341O|+___o_+___________________________________|4.71%|0.02%
6.7870|~352O|____+_____________________________________|4.86%|-0.15%
Column|~363O|3_3_4_1_4_3_9_4_5_7_5_2_4_5_4_7_4_4_6_3_3_|
Count|~374O||______5_______________O___________________|

11jan211738.png

BJF Trading Group. Excel Chart. Full size attached.
 

Attachments

  • 11Jan221203.zip
    10.8 KB · Views: 130
*DXY as forecasted achieved the 78 handle.
*This manifested on our screens this week and was mainly due to the Leadership of EURUSD to the upside above the long awaited StopHunt over 1.3497,there were still many undercurrents of coming USD strength.The undercurrents came in the form of risk aversion pairs USDCAD, USDJPY and USDCHF staging rather dramatic advances in the face of DXY weakness throughout most of the trading week.
*One reason of course is the upside leader EURUSD has the heaviest weighting in the DXY basket, but I suspect big players are beginning to take off risk and are also hedging as multiple asset classes are breaking down and or topping.(ForexStopHunters)
*U.S. DOLLAR INDEX: Dropped nearly 1% on Friday to 78.12, which would mark its lowest close since November 12.
procent11Jan231517.PNG

Code:
http://img593.imageshack.us/img593/2894/big11jan231133.png
Full size.
"P&F _DXY10080 Box Size1 70X3 or(5.33%) HI/LO
Data 120.51 - 70.7 ~ 215.72 Month ~ 6566 Day
Database 939 records 78.14 (Last Close)
1993-01-24 00~00 ~ 17.98 Years
2011-01-16 00~00 (GMT+01:00) Paris
BJF Trading Group MDunleavy chart"
Code:
http://docs.google.com/View?id=dg3m7zmf_24hf487zfd

120.7|~17O||________________________+___+___________________________|-0.16%|70.72%
119.0|~34O||____________________+___x_o_x_+_________________________|1.25%|68.32%
117.3|~51O||____________________x_+_x_o_x_o_+_______________________|2.66%|65.91%
115.6|~68O||____________________x_o_x_o_x_o___+_____________________|4.07%|63.51%
113.9|~85O||____________________x_o_x_o_x_o_____+___________________|5.49%|61.1%
112.2|~1O2O|____________________x_o_x_o___o_______+_________________|6.9%|58.7%
110.5|~119O|____________________x_o_x_____o_________+_______________|8.31%|56.29%
108.8|~136O|____________________x_o_______o___________+_____________|9.72%|53.89%
107.1|~153O|____________________x_________o_____________+___________|11.13%|51.49%
105.4|~17OO|________________+___x_________o_______________+_________|12.54%|49.08%
103.7|~187O|____________+___x_+_x_________o_________________+_______|13.95%|46.68%
102.0|~2O4O|________+___x_+_x_o_x_________o___________________+_____|15.36%|44.27%
100.3|~221O|________x_+_x_o_x_o_x_________o_____________________+___|16.77%|41.87%
98.60|~238O|____+___x_o_x_o_x_o_________+_o_x_____________________+_|18.18%|39.46%
96.90|~255O|____x_+_x_o_x_o_x_________+___o_x_o_____________________|19.59%|37.06%
95.20|~272O|+___x_o_x_o___o_x_______+_____o_x_o_____________________|21%|34.65%
93.50|~289O|x_+_x_o_x_____o_______+_______o_+_o_____________________|22.41%|32.25%
91.80|~3O6O|__o_x_o_x___________+_________+___o_x___x_______________|23.82%|29.84%
90.10|~323O|__o_x_o_x_________+_______________o_x_o_x_o_____________|25.23%|27.44%
88.40|~34OO|__o_+_o_x_______+_________________o_x_o_x_o_x___x___x___|26.65%|25.04%
86.70|~357O|__+___o_x_____+___________________o_x_o_x_o_x_o_x_o_x_o_|28.06%|22.63%
85.00|~374O|______o_x___+_____________________o_+_o_x_o_x_o_x_o_x_o_|29.47%|20.23%
83.30|~391O|______o_x_+_______________________+___o_x_o_x_o_x_o_x_o_|30.88%|17.82%
81.60|~4O8O|______o_+_____________________________o_+_o_x_o_x_o_x_o_|32.29%|15.42%
79.90|~425O|______+_______________________________+___o_x_o_x_o_x_o_|33.7%|13.01%
78.20|~442O|==========================================o=x=o===o=x=o=|35.11%|10.61%
76.50|~459O|__________________________________________o_x_____o_x_o_|36.52%|8.2%
74.80|~476O|__________________________________________o_x___+_o_+___|37.93%|5.8%
73.10|~493O|__________________________________________o_x_+___+_____|39.34%|3.39%
71.40|~51OO|__________________________________________o_+___________|40.75%|0.99%
69.70|~527O|__________________________________________+_____________|42.16%|-1.41%
Column||||||1_3_5_9_1_3_4_5_6_3_1_5_6_5_4_1_3_8_4_6_6_1_1_6_6_8_8_7_|
Count|||||||________1___________1_________5___________2_O___________|

*But nevertheless! Prediction. Up from 77.74 to 79.58!
mane11Jan231524.PNG

BJF Trading Group. Excel Chart. Full size attached.
 

Attachments

  • View_$index(DXY).zip
    8 KB · Views: 133
*AUD\SEK outlook.( AUD\SEK = AUD\USD X USD\SEK )
*Rally from 6.2635 to 6.4903. Up 2% in one day!
*It was last Friday 28 January. Today rally was
continued until 6.5018.
*In the future, we will probably see correction,
pullback, consolidation in this range.
*See charts below.

last11jan311649.png

Code:
Charts_Review_More_Pictures
https://docs.google.com/View?id=dg3m7zmf_28g4bmvtgt
https://docs.google.com/View?id=dcftkq53_237cvshswvk
mane11jan300743.png

BJF Trading Group. Excel Chart. Full size attached.
 

Attachments

  • view11Jan3016.zip
    5.7 KB · Views: 144
Using P&F (Point and Figure) Charts in Forex Trading.
Review of online published on P & F charts.
11feb0617041.png

Code:
http://img145.imageshack.us/img145/6153/11feb061247.pdf
 

Attachments

  • XO11Feb06.zip
    14.4 KB · Views: 177
2011-Feb-12 09-24 (GMT+01:00) Paris
I remain bearish on EUR/USD too.
EUR/USD's break of 1.3510 support last week indicates that whole decline from 1.3860 has resumed. Initial bias remains on the downside towards 100% projection at 1.3393 and possibly below. However, we'd remain cautiously bullish in EUR/USD as long as 1.3253 cluster support (61.8% retracement of 1.2873 to 1.3860 at 1.3250) [ by ActionForex]
Trade Idea: EUR/USD - Sell ⬇ (Stop Limit) at 1.3500; Target: 1.3250 ; Stop: 1.3600.

"P&F EURUSD10080 Box Size 260X3 or(6.43%) HI/LO
Data 1.6038 - 0.8225 ~ 242.4 Month ~ 7378 Day
Database 1055 records 1.35513 (Last Close)
1990-11-25 00~00 ~ 20.2 Years
2011-02-06 00~00 (GMT+01:00) Paris
BJF Trading Group MDunleavy chart"
11feb131844.png

mane11feb121152.png

BJF Trading Group. Excel Chart. Full size attached.
 

Attachments

  • EURUSD11Feb13.zip
    6.9 KB · Views: 122
After an upbeat week, the pound faces new information about the upcoming rate hike and also a worrying GDP among other events. Here’s an outlook for the British events and an updated technical analysis for GBP/USD.
I am neutral on GBP/USD.
The rate policy is still unclear, although it will come earlier than expected. On the other hand, we’ll get a reminder of the horrible fourth quarter. Another interesting week is ahead of us, but a major breakthrough isn’t likely. [by forexcrunch].

"P&F GBPUSD10080 Box Size 270X4 or(6.23%) HI/LO
Data 2.1161 - 1.3503 ~ 241.71 Month ~ 7357 Day
Database 1052 records 1.62521 (Last Close)
1990-12-23 00~00 ~ 20.14 Years
2011-02-13 00~00 (GMT+01:00) Paris
BJF Trading Group MDunleavy chart"
11feb210802.png

mane11feb201902.png

BJF Trading Group. Excel Chart. Full size attached.
^^^ OR vvv
=>>>img141.imageshack.us/img141/8787/11feb211149.pdf
 

Attachments

  • GBPUSD11Feb20.zip
    5.2 KB · Views: 132
Hi MDunleavy,

I have been following your posts with great interest. Do you have a point & figure trading indicator that works well with metatrader. Thank you.
 
Hi MDunleavy,

I have been following your posts with great interest. Do you have a point & figure trading indicator that works well with metatrader. Thank you.

Hi!
And this is right for you? It's free indicators. There are explanations.
Post #46 this topic. Attachment.
11feb240812.png


This is the old indicator, but the best yet. But it's free!:)

I have, and other materials. If you need to, I'll send (approx. 40 MB). I'll upload to yousendit_com.
 
This has been a turbulent week on the geopolitical front, triggering waves in the stock market and sending the price of crude oil through the roof. While the stock market corrects itself (as we anticipated), the price of crude oil seems to be creeping ever higher, putting upward pressure on the price of fuel and energy. Worse still is the serious effect this could have on the economic recovery that everyone has been banking on.[marketoracle]There's no way of knowing how events will unfold. Since the current oil price is always the best predictor of the future oil price in the very short-term, I predict that Nymex WTI will be priced in the $93-$104 range on March 12th.
------------------
"P&F QM_CONT1440 Box Size $4X3 or(13.94%) HI/LO
Data 147.3 - 24.825 ~ 99.68 Month ~ 3034 Day
Database 2000 records 98.225 (Last Close)
2002-11-05 00~00 ~ 8.31 Years
2011-02-25 00~00 (GMT+01:00) Paris
BJF Trading Group MDunleavy chart"
------------------
148.00|~4||____________+_________________________|-0.48%|496.17%
144.00|~8||____________x_+_______________________|2.24%|480.06%
140.00|~12|____________x_o_+_____________________|4.96%|463.95%
136.00|~16|____________x_o___+___________________|7.67%|447.83%
132.00|~2O|____________x_o_____+_________________|10.39%|431.72%
128.00|~24|____________x_o_______+_______________|13.1%|415.61%
124.00|~28|____________x_o_________+_____________|15.82%|399.5%
120.00|~32|____________x_o___________+___________|18.53%|383.38%
116.00|~36|____________x_o_____________+_________|21.25%|367.27%
112.00|~4O|____________x_o_______________+_______|23.96%|351.16%
108.00|~44|____________x_o_x_______________+_____|26.68%|335.05%
104.00|~48|____________x_o_x_o_______________+___|29.4%|318.93%
100.00|~52|________x___x_o_x_o_________________x_|32.11%|302.82%
96.00||~56|________x_o_x_o_x_o_________________x_|34.83%|286.71%
92.00||~6O|________x_o_x_o___o_________________x_|37.54%|270.59%
88.00||~64|________x_o_______o_________________x_|40.26%|254.48%
84.00||~68|________x_________o_____________x___x_|42.97%|238.37%
80.00||~72|________x_________o_____________x_o_x_|45.69%|222.26%
76.00||~76|____x___x_________o_____________x_o_x_|48.4%|206.14%
72.00||~8O|____x_o_x_________o_________x___x_o_x_|51.12%|190.03%
68.00||~84|x___x_o_x_______+_o_________x_o_x_o___|53.84%|173.92%
64.00||~88|x_o_x_o_x_____+___o_________x_o_x_____|56.55%|157.8%
60.00||~92|x_o_x_o_x___+_____o_________x_o_______|59.27%|141.69%
56.00||~96|x_o___o_x_+_______o_________x_________|61.98%|125.58%
52.00|~1OO|x_____o_+_________o_________x_______+_|64.7%|109.47%
48.00|~1O4|x_____+___________o_x___x___x_____+___|67.41%|93.35%
44.00|~1O8|x_________________o_x_o_x_o_x___+_____|70.13%|77.24%
40.00|~112|x_________________o_x_o_x_o_x_+_______|72.84%|61.13%
36.00|~116|x_________________o___o___o_+_________|75.56%|45.02%
32.00|~12O|x_________________________+___________|78.28%|28.9%
28.00|~124|x_____________________________________|80.99%|12.79%
24.00||||||1_3_5_6_1_3_1_1_4_1_3_3_3_3_9_3_6_4_8_|
Column|||||1_______2___4_3___8___________________|


mane11feb272145.png

BJF Trading Group. Excel Chart. Full size attached.
 

Attachments

  • Oil11Feb28.zip
    5.6 KB · Views: 140
I am neutral on USD/JPY.
The magnitude of Middle -Eastern events has been extraordinary. This sent oil up and the dollar down, with the yen being one of the big winners. When the Libyan crisis ends, dollar/yen will rise back up, but the level of uncertainty is very high.
I am neutral on EUR/USD too.
The clear statement about rate hikes will continue to boost the Euro, as well as the strength in Germany. On the other hand, the US economy is moving forwards, as seen in the improving job market, and another round of the debt crisis is around the corner. Choppy trading is likely, until a new direction is seen – probably down.
[forexcrunch]
EUR\JPY = EUR\USD X USD\JPY
Movement will be neutral as well. Or may turn bearish.... See chart....

Trade Idea: EUR/JPY- Sell (Stop Limit) at 115.50; Target: 112.00 ; Stop: 116.50.

"P&F EURJPY10080 Box Size300X4 or(8.99%) HI/LO
Data 177.98 - 88.87 ~ 241.94 Month ~ 7364 Day
Database 1053 records 115.117 (Last Close)
1990-12-30 00~00 ~ 20.16 Years
2011-02-27 00~00 (GMT+01:00) Paris
BJF Trading Group MDunleavy chart"
xo11m071.png

large11m051.png
mane11m051.png


BJF Trading Group. Excel Chart. Full size attached.
 

Attachments

  • eurjpy11M07.zip
    5.7 KB · Views: 136
*Trade Idea: NZD/USD- Sell (Stop Limit) at 1.7410\40; Target: 1.7100\30; Stop: 1.7480\1.7520.
*I remain bearish on NZD/USD.
*The consequences of the devastating earthquake are still felt in New Zealand. A rate cut to accommodate to the economic weakness will likely drive prices even lower.
=======================
*The NZD/USD has formed a hammer at the 0.7350 level, a key support level for the last several months. Because of this, it looks decidedly bullish for the short-term. It appears that support will end up holding, and as such – we could see more consolidation between this level and 0.7800.
Any break above Thursday’s high. 0.7377 is a buy signal towards as highs at 0.78, and any break below its low at 0.7320 is a sell signal that could lead up down to 0.70 or lower. This pair is at one of those places you like to take longer-term trades since it is such an important area.[dailymarkets]


"P&F NZDUSD10080 Box Size 150X3 or(7.43%) HI/LO
Data 0.8214 - 0.39 ~ 243.32 Month ~ 7406 Day
Database 1059 records 0.74246 (Last Close)
1990-11-25 00~00
2011-03-06 00~00 (GMT+01:00) Paris
BJF Trading Group MDunleavy chart"
~~~>img717.imageshack.us/img717/3320/xo11m13.png
~~~>img857.imageshack.us/img857/2776/mane11m12.png
~~~>img858.imageshack.us/img858/2966/big11m12.png

BJF Trading Group. Excel Chart. Full size attached.
 

Attachments

  • 11M12.zip
    6.2 KB · Views: 137
A comparison of algorithms for the three programs.
Indicator puma1, Bull's-Eye Broker and XL ChartPro.

~~~>img24.imageshack.us/img24/5157/cpa11m211.png
~~~>docs.google.com/leaf?id=0BxxKzvQ2GlM8MzZmNWI3NjctOWJjNS00ZjczLTgxMzYtZDZjZDBiZmJjOTgz&sort=name&layout=list&num=50
===========================
Look carefully at the English pound!
Trade Idea: GBP\USD - Sell Stop at 1.6259; Target: 1.5961; Stop: 1.6351.
mane11m223.png

Big Picture full size ↓ and Exel chart.
~~~>img846.imageshack.us/img846/7990/big11m22.png
^^^ Picture; Excel file vvv
~~~>docs.google.com/leaf?id=0BxxKzvQ2GlM8M2Q5NDRmMTctYmNmMC00OTI3LTlmM2ItOGEyZTA1MjI2YjFm&sort=name&layout=list&num=50
 
I turn bearish on NZD/CAD.
I'm afraid of a bull trap...NZDCAD=NZDUSD X USDCAD
=========================================
_____The Canadian economy won't release any economic fundamentals before next Wednesday,....
_____NzdUsd pair was able to rise during the last week to cover its previous losses, as the economy expanded ......
[ForexMansion.com]
Learn more ....
~~~>img593.imageshack.us/img593/5461/11m26.pdf
mane11m261.png
 

Attachments

  • 11M27.zip
    6.1 KB · Views: 136
Trade Idea: GBP/CHF - Sell ???
tst11m29.png

~~~>docs.google.com/document/pub?id=1oYwnTw8uVA5GpqsfsK3dclJskwOR5uBG0Q-1kgAYRsQ
 
so far bullish restance which is very difficult to trade

i opened very small sell and look for 1.4192 for more sell and new S/R zone
 

Attachments

  • bullish resitance.JPG
    bullish resitance.JPG
    82.5 KB · Views: 202
so far bullish restance ~~~r 1.4192 for more sell and new S/R zone

I remain bearish on EUR.
This applies to the EUR/USD and EUR / GBP.
EUR/USD fragment
11m30cr.png

Enlarge this image
~~~>img31.imageshack.us/img31/5209/11m30.gif
EUR/GBP
~~~>docs.google.com/document/pub?id=1mY7CaGXEww84HsEXrclv0a_veWzgC_93_z5eBgZ8F6g
 
Top