Pace of Tape - Measure trade intensity to detect reversals

cunparis

Junior member
Messages
28
Likes
0
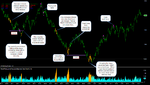
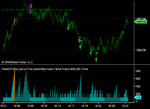
I'd like to share something I've been working on. I'm using trade intensity to detect buying/selling exhaustion which often leads to reversals. The reversal can be a pause, a small pullback, or a full reversal. So this isn't something one can use mechanically but rather as an input into a discretionary trading method.

I measure trade intensity by the amount of trades occuring in a given time. This is equivalent to watching the time & sales for periods when the trades start scrolling really fast. I find that with this indicator I no longer have to watch time & sales.

I'd like to get some feedback on this idea and improve it. So far I have it available for Ninjatrader & Multicharts and you can look at the source code and program it for other platforms. If you do please send me a copy so that I can make it available on my blog and make it available to everyone else.

I'm attaching a chart showing a bit of how I use it. I have also created a blog page and a video which explains it in more detail.

http://www.tradewiththeflow.com/201...tape-indicator/

Thanks for looking, I hope you find it useful. And good trading to everyone!
 

Attachments

  • pace of tape - trade intensity example on fesx 20100517.png
    pace of tape - trade intensity example on fesx 20100517.png
    84.7 KB · Views: 5,459
Hi cunparis,
Welcome to T2W.
I don't have NT or Multicharts, so I can't upload your indicator to my charting software (InvestorRT) but, I'm interested in your approach nonetheless, as it sounds similar to cumulative delta - to which I'm a recent convert. I've always wanted to track T&S graphically, as I can't make head or tail of all those numbers flashing past in the T&S window. IMO, cumulative volume delta gets around that problem pretty well.
;)
Tim.

Hi Tim. My indicator is totally different than cumulative delta. My mind still isn't made up on cumulative delta. I don't find it useful in my trading but maybe I'm not looking at it right.

Unfortunately InvestorRT's RTL is way too limited for me to program the Pace of Tape for IRT or Market Delta. It is possible to program for IRT using C/C++ to make a DLL but I don't know how to do that. The code is really simple so if someone can help me with the DLL part I could give it a try.
 
great chart. please check the correlation factor of ticks and volume !

upps, greater than 0.76.
what is your conclusion out of this result ?
 
There is an entire thread on Traderslaboratory about this by UrmaBlume, Have you seen it ?


Paul
 
There is an entire thread on Traderslaboratory about this by UrmaBlume, Have you seen it ?

I have read it a while ago but it seemed too complicated for me and I had no idea how he did it. Then later I found a video on you tube by school of trade and that's when I got the idea to make my own based on the speed of ticks on the tape. It's not based on volume.

I compare my results to Urma's and they're similar but where his excels is the really good turning points have a much greater magnitude whereas mine will give many signals all the same magnitude. So I'm now rereading his threads and am trying different ideas to incorporate buying & selling. Kind of stuck at the moment so if anyone has any ideas I can try them out.

So in summary when I made mine I didn't really have Urma's in mind but now i realize they're actually similar. :)
 
it seems no different to fading extremes on $TICK

and I doubt it's anywhere near as good real-time as genuine pit audio.
try it for 3 months, you'll never look back
 
I'm curious how you use the pit audio. I've heard samples of trader's audio and the other one the trade news or something. I personally prefer to have it quiet and some nice relaxing new age music on. Most of my time is spent doing other things as I wait for a good setup.

Can you explain a bit about how you fade tick extremes? I look for divergences but don't do anything with extremes.

Thanks.
 
I have a friend using this on Ninja trader. Im looking for a copy on my tos platform personally. Im not certain I will use it yet but it shows promise
 
CUnparis, is it possible understand that the trade are on bis side on on ask side and plot different color?

Yes this is possible, the programming is a bit more complicated. I tried it out but I didn't find it more useful than the regular pace of tape.
 
Top