No matter which market you trade – stocks, forex or futures – each second the markets are open provides an opportunity to trade. Yet not every second provides a high-probability trade. In a sea of nearly infinite possibilities, put each trade you consider through a five-step test so you'll only take trades that align with your trading plan and offer good profit potential for the risk being taken. Apply the test whether you're a day trader, swing trader or investor. At first it will take some practice, but once you become familiar with the process, it takes only a few seconds to see if a trade passes the test, telling you whether you should trade or not.
Step 1: The Trade Setup
The setup is the basic conditions that need to be present in order to even consider a trade. For example, if you're a trend-following trader, then a trend needs to be present. Your trading plan should define what a tradable trend is (for your strategy). This will help you avoid trading when a trend isn't there. Think of the "setup" as your reason for trading.
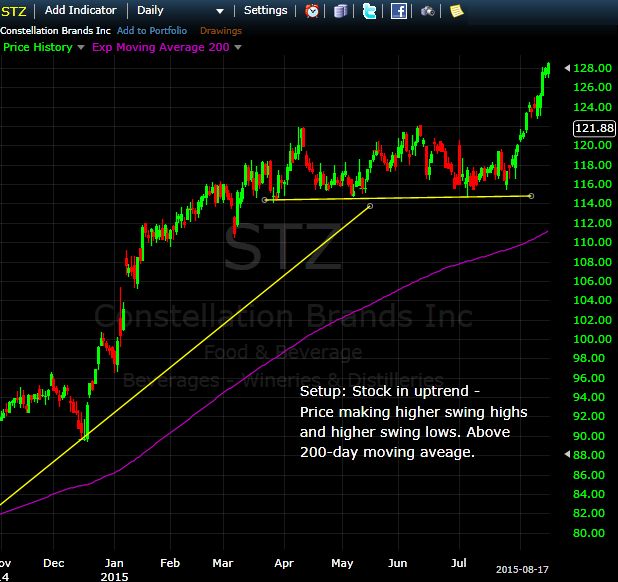
Figure 1 shows an example of this in action. The stock price is moving higher overall, as represented by the higher swing highs and lows, as well as the price being above a 200-day moving average. Your trade setup may be different, but you should make sure that conditions are favorable for the strategy being traded.

Fig1. Stock in Uptrend, Providing Possible Trade Setups for Trend Traders
If your reason for trading isn't present, don't trade. If your reason for trading – the setup – is present, then proceed to the next step.
Step 2: The Trade Trigger
If your reason for trading is present, you still need a precise event that tells you now is the time to trade. In Figure 1, the stock was moving in an uptrend for a the entire time, but some moments within that uptrend provide better trade opportunities than others.
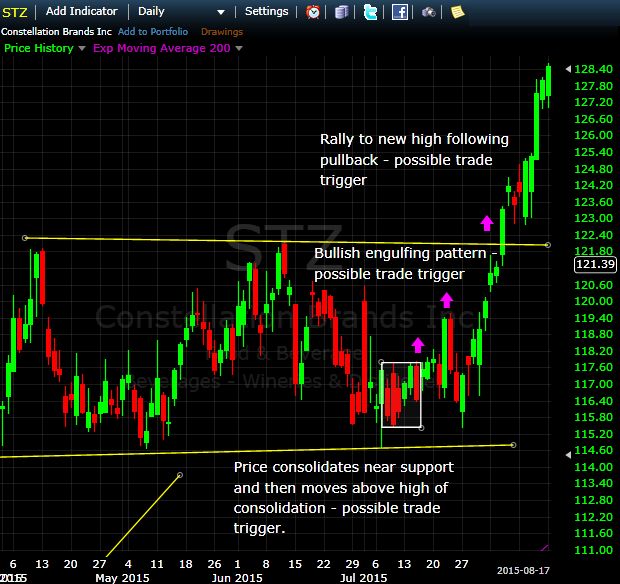
Some traders like to buy on new highs after the price has ranged or pulled back. In this case, a trade trigger could be when the price rallies above the $122 resistance area in August.
Other traders like to buy during a pullback. In this case, when the price pulls back to support near $115, wait for the price to form a bullish engulfing pattern or to consolidate for several price bars and then break above the consolidation. Both of these are precise events that separate trading opportunities from the all the other price movements (which you don't have a strategy for).

Fig 2. Possible Trade Triggers in Uptrending Stock
Figure 2 shows three possible trade triggers that occur during this stock uptrend. What your exact trade trigger is depends on the trading strategy you are using. The first is a consolidation near support: The trade is triggered when the price moves above the high of the consolidation. Another possible trade trigger is a bullish engulfing pattern near support: A long is triggered when the bullish candle forms. The third trigger to buy is a rally to a new high price following a pullback or range.
Before a trade is taken though, check to make sure the trade is worth taking. With a trade trigger, you always know where your entry point is in advance. For example, throughout July, a trader would know that a possible trade trigger is a rally above the June high. That provides time to check the trade for validity, with steps three through five, before the trade is actually taken.
Step 3: The Stop Loss
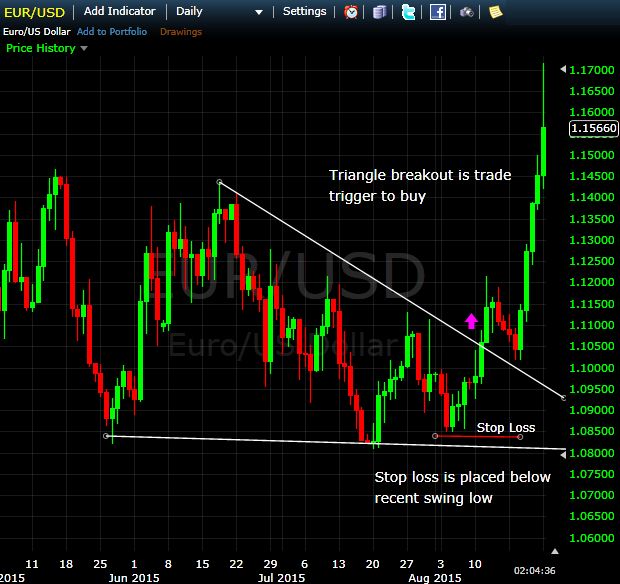
Having the right conditions for entry and knowing your trade trigger isn't enough to produce a good trade. The risk on that trade must also be managed with a stop-loss order. There are multiple ways to place a stop loss. For long trades, a stop loss is often placed just slightly below a recent swing low and for a short trade just slightly above a recent swing high. Another method is called the Average True Range (ATR) stop loss; it involves placing the stop-loss order a certain distance from the entry price, based on volatility.

Fig 3. Long Trade Example with Stop Loss Placement
Establish where your stop loss will be. Once you know the entry and stop loss price, you can calculate the position size for the trade.
Step 4: The Price Target
You now know that conditions are favorable for a trade, as well as where the entry point and stop loss will go. Next, consider the profit potential.
A profit target is based on something measurable and not just randomly chosen. Chart patterns, for example, provide targets based on the size of the pattern. Trend channels show where the price has had a tendency to reverse; if buying near the bottom of the channel, set a price target near the top of the channel.
In Figure 3, the EUR/USD triangle pattern is roughly 600 pips at its widest point. Added to the triangle breakout price, that provides a target of 1.1650. If trading a triangle breakout strategy, that is where the target to exit the trade (at a profit) is placed.
Establish where your profit target will be based on the tendencies of the market you're trading. A trailing stop loss can also be used to exit profitable trades. If using a trailing stop loss, you won't know your profit potential in advance. That is fine though, because the trailing stop loss allows you to extract profits from the market in a systematic (not random) manner.
Step 5: The Reward-to-Risk
Strive to take trades only where the profit potential is greater than 1.5 times the risk. For example, losing $100 if the price reaches your stop loss means you should be making $150 or more if the target price is reached.
In Figure 3, the the risk is 210 pips (difference between entry price and stop loss), but the profit potential is 600 pips. That's a reward-to-risk ratio of 2.86:1 (or 600/210).
If using a trailing stop loss, you won't be able to calculate the reward-to-risk on the trade. However, when taking a trade, you should still consider if the profit potential is likely to outweigh the risk.
If the profit potential is similar to or lower than the risk, avoid the trade. That may mean doing all this work only to realize you shouldn't take the trade. Avoiding bad trades is just as important to success as participating in favorable ones.
Other Considerations
The five-step test acts as a filter so that you're only taking trades that align with your strategy, ensuring that these trades provide good profit potential relative to the risk. Add in other steps to suit your trading style. For example, day traders may wish to avoid taking positions right before major economic numbers or a company's earnings are released. In this case, to take a trade, check the economic calendar and make sure no such events are scheduled for while you're likely to be in the trade.
In Summary
Make sure conditions are suitable for trading a particular strategy. Set a trigger that tells you now is the time to act. Set a stop loss and target, and then determine if the reward outweighs the risk. If it does, take the trade; if it doesn't, look for a better opportunity. Consider other factors that may affect your trading, and implement additional steps if required. This may seem like a long process, yet once you know your strategy and get used to the steps, it should take only a few seconds to run through the entire list. Making sure each trade taken passes the five-step test is worth the effort.
Cory Mitchell can be contacted at Vantage Point Trading
Step 1: The Trade Setup
The setup is the basic conditions that need to be present in order to even consider a trade. For example, if you're a trend-following trader, then a trend needs to be present. Your trading plan should define what a tradable trend is (for your strategy). This will help you avoid trading when a trend isn't there. Think of the "setup" as your reason for trading.
Figure 1 shows an example of this in action. The stock price is moving higher overall, as represented by the higher swing highs and lows, as well as the price being above a 200-day moving average. Your trade setup may be different, but you should make sure that conditions are favorable for the strategy being traded.

Fig1. Stock in Uptrend, Providing Possible Trade Setups for Trend Traders
If your reason for trading isn't present, don't trade. If your reason for trading – the setup – is present, then proceed to the next step.
Step 2: The Trade Trigger
If your reason for trading is present, you still need a precise event that tells you now is the time to trade. In Figure 1, the stock was moving in an uptrend for a the entire time, but some moments within that uptrend provide better trade opportunities than others.
Some traders like to buy on new highs after the price has ranged or pulled back. In this case, a trade trigger could be when the price rallies above the $122 resistance area in August.
Other traders like to buy during a pullback. In this case, when the price pulls back to support near $115, wait for the price to form a bullish engulfing pattern or to consolidate for several price bars and then break above the consolidation. Both of these are precise events that separate trading opportunities from the all the other price movements (which you don't have a strategy for).

Fig 2. Possible Trade Triggers in Uptrending Stock
Figure 2 shows three possible trade triggers that occur during this stock uptrend. What your exact trade trigger is depends on the trading strategy you are using. The first is a consolidation near support: The trade is triggered when the price moves above the high of the consolidation. Another possible trade trigger is a bullish engulfing pattern near support: A long is triggered when the bullish candle forms. The third trigger to buy is a rally to a new high price following a pullback or range.
Before a trade is taken though, check to make sure the trade is worth taking. With a trade trigger, you always know where your entry point is in advance. For example, throughout July, a trader would know that a possible trade trigger is a rally above the June high. That provides time to check the trade for validity, with steps three through five, before the trade is actually taken.
Step 3: The Stop Loss
Having the right conditions for entry and knowing your trade trigger isn't enough to produce a good trade. The risk on that trade must also be managed with a stop-loss order. There are multiple ways to place a stop loss. For long trades, a stop loss is often placed just slightly below a recent swing low and for a short trade just slightly above a recent swing high. Another method is called the Average True Range (ATR) stop loss; it involves placing the stop-loss order a certain distance from the entry price, based on volatility.

Fig 3. Long Trade Example with Stop Loss Placement
Establish where your stop loss will be. Once you know the entry and stop loss price, you can calculate the position size for the trade.
Step 4: The Price Target
You now know that conditions are favorable for a trade, as well as where the entry point and stop loss will go. Next, consider the profit potential.
A profit target is based on something measurable and not just randomly chosen. Chart patterns, for example, provide targets based on the size of the pattern. Trend channels show where the price has had a tendency to reverse; if buying near the bottom of the channel, set a price target near the top of the channel.
In Figure 3, the EUR/USD triangle pattern is roughly 600 pips at its widest point. Added to the triangle breakout price, that provides a target of 1.1650. If trading a triangle breakout strategy, that is where the target to exit the trade (at a profit) is placed.
Establish where your profit target will be based on the tendencies of the market you're trading. A trailing stop loss can also be used to exit profitable trades. If using a trailing stop loss, you won't know your profit potential in advance. That is fine though, because the trailing stop loss allows you to extract profits from the market in a systematic (not random) manner.
Step 5: The Reward-to-Risk
Strive to take trades only where the profit potential is greater than 1.5 times the risk. For example, losing $100 if the price reaches your stop loss means you should be making $150 or more if the target price is reached.
In Figure 3, the the risk is 210 pips (difference between entry price and stop loss), but the profit potential is 600 pips. That's a reward-to-risk ratio of 2.86:1 (or 600/210).
If using a trailing stop loss, you won't be able to calculate the reward-to-risk on the trade. However, when taking a trade, you should still consider if the profit potential is likely to outweigh the risk.
If the profit potential is similar to or lower than the risk, avoid the trade. That may mean doing all this work only to realize you shouldn't take the trade. Avoiding bad trades is just as important to success as participating in favorable ones.
Other Considerations
The five-step test acts as a filter so that you're only taking trades that align with your strategy, ensuring that these trades provide good profit potential relative to the risk. Add in other steps to suit your trading style. For example, day traders may wish to avoid taking positions right before major economic numbers or a company's earnings are released. In this case, to take a trade, check the economic calendar and make sure no such events are scheduled for while you're likely to be in the trade.
In Summary
Make sure conditions are suitable for trading a particular strategy. Set a trigger that tells you now is the time to act. Set a stop loss and target, and then determine if the reward outweighs the risk. If it does, take the trade; if it doesn't, look for a better opportunity. Consider other factors that may affect your trading, and implement additional steps if required. This may seem like a long process, yet once you know your strategy and get used to the steps, it should take only a few seconds to run through the entire list. Making sure each trade taken passes the five-step test is worth the effort.
Cory Mitchell can be contacted at Vantage Point Trading
Last edited by a moderator:
