Day trading involves isolating the current trend from market noise and then capitalizing on that trend through well-timed entries and profit taking. These factors play a crucial role in managing potential profit expectations and risk. Trading has many challenges, but by sticking to certain guidelines success is more likely. Since the market always moves in waves, on all time frames, rules can be created for exploiting this phenomenon. The following five rules will help traders find high profit potential, low risk, intra-day trades.
1. Trade only with the current intra-day trend
Trading with the trend allows for low risk entries and high profit potential if the trend continues. Intra-day trends do not continue indefinitely, reversals do occur, but usually one or two trades, and sometimes more, can be made before the trend reverses.
Isolating the trend can be the difficult part. Trendlines provide a very simple and useful entry and stop loss strategy. Focus on trading with the dominant trend of the day. When that trend shifts, begin trading with the new trend. Figure 1 shows several short-term trends during a typical day
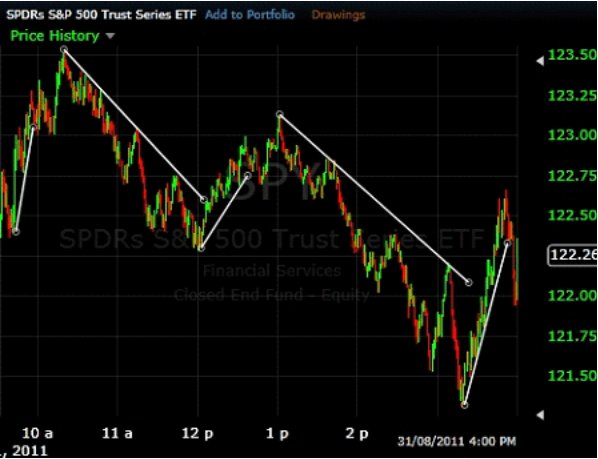
Fig 1
SPY with Trendlines – 1 Minute
Source: Free Stock Charts
More trendlines can be drawn when trading in real time, for the varying degrees of each trend. Drawing in more trendlines can provide more signals and also can provide greater insight into the changing market dynamics.
2. Trade strong stocks in an uptrend, weak stocks in a downtrend
Most traders will find it beneficial to trade stocks or ETFs that have at least a moderate to high correlation with the S&P 500, Dow or Nasdaq indexes. By trading stocks or ETFs with a high correlation to the major indexes, stocks that are relatively weak or strong, compared to the index, can be isolated. This creates an opportunity for the day trader, as he or she can isolate which stocks are likely to provide a better return, given the movement of individual stocks relative to the index.
When the indexes/market futures are moving higher, traders should look to buy stocks that are moving up more aggressively than the futures. When the futures pull back, a strong stock will not pull back as much, or may not even pull back at all. These are the stocks to trade in an uptrend, as they lead the market higher and thus provide more profit potential and lower risk; smaller pullbacks mean less risk.
When the indexes/futures are dropping, short sell stocks that drop more than the market. When the futures move higher within the downtrend, a weak stock will not move up as much, or will not move up at all. Weak stocks are less risky when in a "short" position and provide great profit potential when the market is falling.
Which stocks and ETFs are stronger or weaker than the market can change daily, although certain sectors may be relatively strong or weak for weeks at a time.
Figure 2 shows SPY, the S&P 500 ETF, compared to XOP, the Oil Exploration and Production ETF. XOP (blue line) was relatively strong compared to the SPY, especially on market rallies. Overall the market moved higher throughout the day, and because XOP had such large gains on rallies, it was a market leader and outperformed SPY on a relative basis throughout the day.
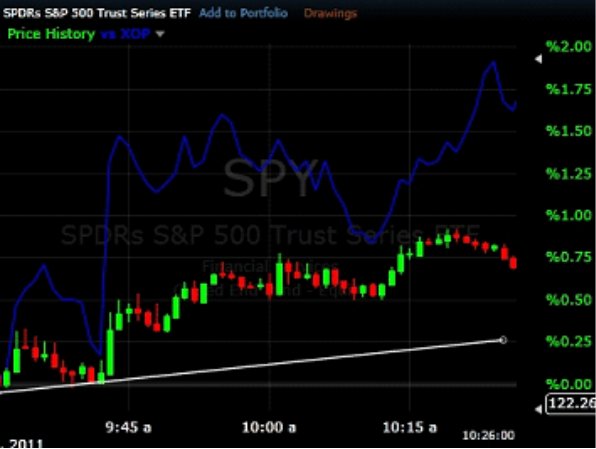
Fig 2
SPY vs. XOP – 2 Minute, August 31, 2011
Source: Free Stock Charts
3. Be patient - wait for the pullback
Trendlines help to show how the market moves in waves. Trendlines are an approximate visual guide to where waves in price will begin and end. Therefore, we can use a trendline for early entry into the next price wave in the direction of the trend.
When entering a long position, buy after the price moves down toward the trendline and then moves back higher. To draw the trend line, a price low and then a higher price low will be needed. The line is drawn connecting these two points and then extended out to the right. Figure 3 shows how XLF, the SPDR Financial Sector ETF, bounced off its trendline twice, providing two potential trade opportunities by being patient and waiting for the pullback in the trendline to occur.
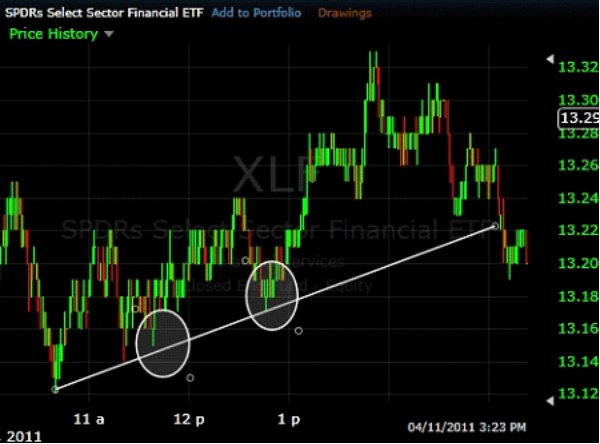
Fig 3
XLF - 1 Minute Chart, November 4, 2011
Source: Free Stock Charts
Short selling in a downtrend would be similar. Wait until the price moves up the downward sloping trendline, then when the stock begins to move back down, this is when the entry is made.
By being patient, these two long trades provide a very low risk entry, as the purchase is made close to the stop level, which could be several cents below the trendline.
4. Take profits
Since markets move in waves, we want to exit before a correction occurs. Day traders have limited time to capture profits and must therefore spend as little time as possible in trades that are losing money or reducing "paper profits" to a substantial degree. When a trade is entered, if it becomes profitable, but the profit is unrealized, it is a called a "paper profit." Day traders want to turn paper profits into real profits before the trend reverses on them.
There are two very simple rules that can be used to take profits when trading with trends.
Figure 4 shows the same XLF chart exemplified earlier. This time entries and exits are marked. The chart shows that as the trend continues higher the price pushes through past highs, which provide an exit for each respective long position taken. Since markets do make double tops, or the price may meet resistance at an old price high, profits can be taken at the same price as the former high, as well. The same method can be applied to downtrends; profits are taken at or slightly below the prior price low in the trend.
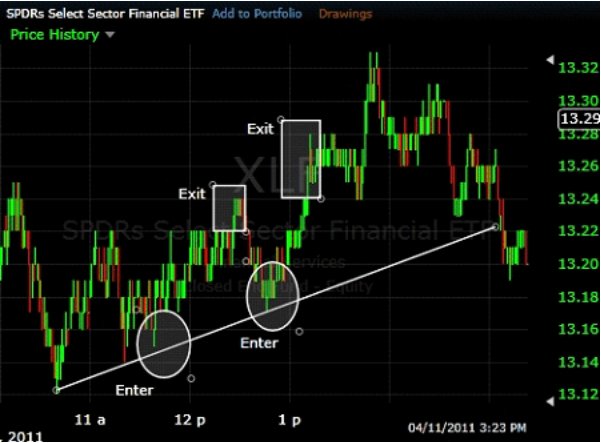
Fig 4
. XLF – 1 Minute Chart, November 4, 2011-11-06
Source: Free Stock Charts
5. When the market reverses, step aside
Markets don't always trend. Intra-day trends can also reverse so often that an overriding direction is hard to establish. If major highs and lows are not being made, make sure the intra-day movements, which will be within a range, are large enough for the potential reward to exceed the risk.
If there are periods where prices move in a horizontal price range, step aside and don’t trade. Alternatively, switch to a range trading type strategy. If switching to a range trading strategy, all the rules still apply. The overall trend does not exist, but is actually a range. Wait for the price to reach near the high of the range and then turn back lower. This will provide a low risk entry and the trade is exited at, or near, the low of the range. The same method can be applied to long entries within a range.
When low risk entries are not present or clearly visible, step aside and do not trade.
In Conclusion
Day traders should trade with the overall trend and patiently wait for low risk entries to potentially profit from that trend. Trendlines can be used as a guide to help traders determine these low-risk entry points, as well provide potential stop levels. Buying stocks that are stronger than the index in uptrends and shorting stocks that are weaker than the index in downtrends should provide more safety and relative out performance profits. Profits must be realized and should be taken at or above the prior price high in an uptrend. Conversely, they should be taken at or below the prior price low in a downtrend. Do no trade when the trend is unclear. If a well defined range develops, this may be traded by using a low risk range trading strategy
Cory Mitchell can be contacted at Vantage Point Trading
1. Trade only with the current intra-day trend
Trading with the trend allows for low risk entries and high profit potential if the trend continues. Intra-day trends do not continue indefinitely, reversals do occur, but usually one or two trades, and sometimes more, can be made before the trend reverses.
Isolating the trend can be the difficult part. Trendlines provide a very simple and useful entry and stop loss strategy. Focus on trading with the dominant trend of the day. When that trend shifts, begin trading with the new trend. Figure 1 shows several short-term trends during a typical day
Fig 1
SPY with Trendlines – 1 Minute
Source: Free Stock Charts
More trendlines can be drawn when trading in real time, for the varying degrees of each trend. Drawing in more trendlines can provide more signals and also can provide greater insight into the changing market dynamics.
2. Trade strong stocks in an uptrend, weak stocks in a downtrend
Most traders will find it beneficial to trade stocks or ETFs that have at least a moderate to high correlation with the S&P 500, Dow or Nasdaq indexes. By trading stocks or ETFs with a high correlation to the major indexes, stocks that are relatively weak or strong, compared to the index, can be isolated. This creates an opportunity for the day trader, as he or she can isolate which stocks are likely to provide a better return, given the movement of individual stocks relative to the index.
When the indexes/market futures are moving higher, traders should look to buy stocks that are moving up more aggressively than the futures. When the futures pull back, a strong stock will not pull back as much, or may not even pull back at all. These are the stocks to trade in an uptrend, as they lead the market higher and thus provide more profit potential and lower risk; smaller pullbacks mean less risk.
When the indexes/futures are dropping, short sell stocks that drop more than the market. When the futures move higher within the downtrend, a weak stock will not move up as much, or will not move up at all. Weak stocks are less risky when in a "short" position and provide great profit potential when the market is falling.
Which stocks and ETFs are stronger or weaker than the market can change daily, although certain sectors may be relatively strong or weak for weeks at a time.
Figure 2 shows SPY, the S&P 500 ETF, compared to XOP, the Oil Exploration and Production ETF. XOP (blue line) was relatively strong compared to the SPY, especially on market rallies. Overall the market moved higher throughout the day, and because XOP had such large gains on rallies, it was a market leader and outperformed SPY on a relative basis throughout the day.
Fig 2
SPY vs. XOP – 2 Minute, August 31, 2011
Source: Free Stock Charts
3. Be patient - wait for the pullback
Trendlines help to show how the market moves in waves. Trendlines are an approximate visual guide to where waves in price will begin and end. Therefore, we can use a trendline for early entry into the next price wave in the direction of the trend.
When entering a long position, buy after the price moves down toward the trendline and then moves back higher. To draw the trend line, a price low and then a higher price low will be needed. The line is drawn connecting these two points and then extended out to the right. Figure 3 shows how XLF, the SPDR Financial Sector ETF, bounced off its trendline twice, providing two potential trade opportunities by being patient and waiting for the pullback in the trendline to occur.
Fig 3
XLF - 1 Minute Chart, November 4, 2011
Source: Free Stock Charts
Short selling in a downtrend would be similar. Wait until the price moves up the downward sloping trendline, then when the stock begins to move back down, this is when the entry is made.
By being patient, these two long trades provide a very low risk entry, as the purchase is made close to the stop level, which could be several cents below the trendline.
4. Take profits
Since markets move in waves, we want to exit before a correction occurs. Day traders have limited time to capture profits and must therefore spend as little time as possible in trades that are losing money or reducing "paper profits" to a substantial degree. When a trade is entered, if it becomes profitable, but the profit is unrealized, it is a called a "paper profit." Day traders want to turn paper profits into real profits before the trend reverses on them.
There are two very simple rules that can be used to take profits when trading with trends.
- In an uptrend or long position, take profits at or slightly above the former price high in the current trend.
- In a downtrend or short position, take profits at or slightly below the former price low in the current trend.
Figure 4 shows the same XLF chart exemplified earlier. This time entries and exits are marked. The chart shows that as the trend continues higher the price pushes through past highs, which provide an exit for each respective long position taken. Since markets do make double tops, or the price may meet resistance at an old price high, profits can be taken at the same price as the former high, as well. The same method can be applied to downtrends; profits are taken at or slightly below the prior price low in the trend.
Fig 4
. XLF – 1 Minute Chart, November 4, 2011-11-06
Source: Free Stock Charts
5. When the market reverses, step aside
Markets don't always trend. Intra-day trends can also reverse so often that an overriding direction is hard to establish. If major highs and lows are not being made, make sure the intra-day movements, which will be within a range, are large enough for the potential reward to exceed the risk.
If there are periods where prices move in a horizontal price range, step aside and don’t trade. Alternatively, switch to a range trading type strategy. If switching to a range trading strategy, all the rules still apply. The overall trend does not exist, but is actually a range. Wait for the price to reach near the high of the range and then turn back lower. This will provide a low risk entry and the trade is exited at, or near, the low of the range. The same method can be applied to long entries within a range.
When low risk entries are not present or clearly visible, step aside and do not trade.
In Conclusion
Day traders should trade with the overall trend and patiently wait for low risk entries to potentially profit from that trend. Trendlines can be used as a guide to help traders determine these low-risk entry points, as well provide potential stop levels. Buying stocks that are stronger than the index in uptrends and shorting stocks that are weaker than the index in downtrends should provide more safety and relative out performance profits. Profits must be realized and should be taken at or above the prior price high in an uptrend. Conversely, they should be taken at or below the prior price low in a downtrend. Do no trade when the trend is unclear. If a well defined range develops, this may be traded by using a low risk range trading strategy
Cory Mitchell can be contacted at Vantage Point Trading
Last edited by a moderator: