Ongoing: very basic gold futures (GC) chart analysis

spearchew

Member
Messages
80
Likes
0
Hi,

(Figured T2W was probably the best choice to post this - the participation in other commodity forums is quite poor.)

I don't base any trades on technical analysis, but I do believe it is important to at least be aware of the major levels, i.e. where other players might be looking to load up/down on contracts, or where stops might get triggered.

What really spooked me about GC this week was an unprecedented move (at least over the last few months, from what I've seen) to the downside. It took less than half a minute, during which time GC had dropped nearly 25 dollars. The sort of nightmare move that could destroy an account, hehe...
http://s15.postimage.org/6vh13w89l/unprecedented_move.png

Anyway, I think the best tool to avoid such potentially catastrophic and sudden moves is to keep on top of the important levels. Obviously nothing presented below is particularly original - but if anyone else who has experience reading charts (and I don't consider myself one of them) would care to share their own take on what they view as the important reference prices for GC, I'd be a willing reader.

Here's my take, for the moment:
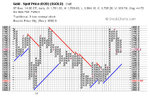
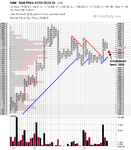
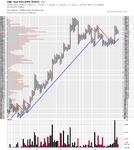
November 29, 2012:

http://s15.postimage.org/i4ms24ue1/2012_11_29_weekly.png

http://s15.postimage.org/7qly8w9nd/2012_11_29_daily.png

http://s15.postimage.org/gob9jzrh5/2012_11_29_hourly.png

http://s14.postimage.org/z0qjb46pr/2012_11_29_half_hourly.png

WRT Technical Analysis, my personal view is that simple is good.
 
My only comment is a volume spike on any time frame be it 5/30/60 minute or daily ,generally is a signal for a reversal.
I am no expert either ,but have been tradeing gold consistently since 1980 and am very new to futures tradeing since 2008.
Historic Charts seem to have gold visit lows 2 times each cycle so I believe we could see 1666 area again as that is the yearly average price.
 
Today we balanced and formed an inside day. Wednesday failed to make a new swing low and so the short-term uptrend remains intact. Yesterday's move down was mostly liquidation, not new selling. Today's close, 1725, is approx fair value for the current distribution ( 1675 low to Fridays high) and also Monthly unchanged.

Short term references are Thursdays range(do we break balance to the upside or downside or possibly a failed break?) the gap above Wednesdays high, the swing low at 1705 +1700 RN, and the Monthly unchanged at 1725.

Personally I wouldn't take a position here unless it's short-term intraday or long term. There's been too much activity at this level recently and opportunity is limited/ high risk imo. That's not to say it can't take off in either direction though.
Gold2.PNG
 
Last edited:
Thanks for your interesting feedback, both.
I'll have another chart-look tomorrow.

Meantime, I'm pasting this from the FT.com
It concerns the insane 25 USD drop earlier this week:

The best comment we’ve seen come from Commerzbank and UBS on Thursday who suggest a fat finger or rogue computer algorithm could be to blame for the disturbance (H/T the FT’s Chris Flood).

Here’s what Commerzbank had to say:

Precious metals: The price of gold shed 2% or more than $30 yesterday in almost no time at all and for a while was trading only just above the $1,700 per troy ounce mark. A computerized sell order was to blame, resulting in an extremely high trading volume in the first minute of futures trading on the New York COMEX exchange. According to Bloomberg data, a total of 486,315 futures contracts were traded on the COMEX yesterday – a record number. This corresponds to around 1,500 tons of gold, or more than half a year’s mining production. What is more, yesterday’s trading volume was almost three times higher than the average volume over the past three months. Because stop-loss thresholds were crossed, there was also follow-up selling for technical reasons which further exacerbated the price slide. The gold price was only able to make a slight recovery yesterday evening, and this morning is trading at around $1,720 per troy ounce. Yesterday’s events are impressive proof that computer-controlled trading systems can bring about massive price fluctuations without any particular trigger being necessary. These are rarely lasting in nature, however. Dragged down by gold, the other precious metals also came under sharp pressure temporarily, above all silver. At its peak, the white precious metal shed 3.3%, likewise accompanied by a very high trading volume – at 163,330 contracts, the highest number of contracts were traded since mid-May 2011 and more than three times as many as the average figure for the past three months. Silver, however, was able to recoup most of its losses by the close of trading, and this morning is trading at a good $33.5 per troy ounce.

And now UBS:

Gold’s violent sell-off upon the CME open captured investor attention far and wide. The nearly $25 instantaneous plummet, resulting from the liquidation of over 1.4 moz on the floor, attracted many theories. A fat finger trade was blamed, but is it a coincidence that yesterday’s volumes nearly equaled the Jan $1690 and $1700 put buying that went through on Wednesday? Or indeed that yesterday’s volumes also matched the increase in CME open interest that occurred last Friday? Either way, this fumigation of the market back to the lows of $1706 relegates Friday’s technical breakout to a distant memory. Physical demand didn’t really react at the time, and although it was a public holiday in India in any case we wouldn’t expect physical buying to kick in so soon after such a violent move. Instead, the overnight activity that followed gives a much clearer picture of where the buying interest lies. And so far that buying interest is certainly quite evident, despite gold’s recovery back to $1720 levels.

We’ll keep you informed if we hear anything more.

In the meantime, there’s also this intriguing assessment from Ross Norman at Sharps Pixley:

The sale looks like a carefully crafted trade prepped and successfully executed by a well known $14b US fund. Prior to the sale there had been an unusually large purchase of gold ‘puts’ – a leveraged options play that profits from a downward spike in prices. There had also been some early selling on the overnight electronic platform presumably to test the waters before the big guns fired a devastating salvo. If you are going to bet, bet big. The short sell on the NY opening at 08:20 had the desired effect on prices, especially as the $1730 level was breached where it triggered ‘stops’ (a bit like the “collect £200″ in monopoly) which had the desired effect of cascading the decline which develops its own momentum. Think World Trade Centre.

The motivation (other than profit) for the trade is clear. It is a bet that the US Fiscal Cliff will be averted and that the Democrats and Republicans will find common ground in their polarised positions on revenue raising between tax increases and austerity cuts. It is also arguably a bet that the US will be out of the mire well before both Europe and Emerging Nations with the dollar positive environment being – by extension – gold negative. In other words, while looking for a Fiscal Cliff we actually found a Gold Cliff.
 
Whatever you trade its always worthwhile looking at the DX, given its affect on risk assets etc.

Monthly- We are balancing. Two inside months after September's large move down. However the break of October's balance to the upside failed to close near unchanged. This would generally be bearish but would like to see its low taken early on in December.

Weekly- You can see via the shaded box that we re-entered the 8 week or so balance and an attempt to move upwards out again failed. Last two weeks put in lower lows. Short term trend, down.

Daily- Acceptance at this weeks lows. Would suggest we want to go lower. However we're at an approx fair value area for this past 8-10 weeks, so the risk of picking a direction from here is high. It's been mostly short term activity (weak hands) last week imo given the support at 80 dead and the identical Thursday and Friday highs.


DX.png


Last weeks profile below shows Volume (histogram bars) and time (Letters) skewed to the downside(the area inbetween the two yellow lines in the 1 std deviation value area) The sell-off of the week previous was late and value was firmly higher at 81. Good acceptance at the 80ish level suggests we are not finished to downside but like I said, back in this balance area its high risk to pick a direction either way.
 

Attachments

  • DX2.png
    DX2.png
    67.8 KB · Views: 322
DX DAILY - simple overview
http://s12.postimage.org/j1o57wd7f/2012_12_02_DX_DAILY.png

Yes I agree, I think you are right to keep an eye on DX - I will get in to the habit of having a look at the daily, daily.

As a general rule, I try not to assign any mental probabilities to the direction of a move - but rather the magnitude of a move (e.g. sharp selling in the event that 79.00 "support" decisively fails).
 
Last edited:
A Point & Figure Chart indicates that Gold is headed for $1,560 as its bearish target.
 
A Point & Figure Chart indicates that Gold is headed for $1,560 as its bearish target.

That depends on your P&F box size and reversal count. Here's the two main Gold P&F charts I look at which are a bit more medium to long term, but both show a flag consolidation formation currently have been on a buy signal since the breakout in August above 1640.

From the price by volume profile at the left of each chart you can see that it is currently at the point where the most volume has changed hands over the last four years. And from the straight volume at the bottom you can see that the October and November pullback was on lighter volume than the breakout column, which is normally a positive sign that it will eventually make an continuation move.

To go to a sell signal you'd need to see a breakdown below 1660 from these charts, but it would need to break below 1600 to change the trend, which is still up from these charts currently.

attachment.php


attachment.php
 

Attachments

  • Gold_PnF_12-12-12.png
    Gold_PnF_12-12-12.png
    18.6 KB · Views: 764
  • SharpChartv05-11.png
    SharpChartv05-11.png
    57.8 KB · Views: 743
Last edited:
http://s9.postimage.org/e3zerb1t9/2012_12_20.png
Gold has taken a beating. Various spikes lower on good volume - someone is dumping it , seems to me.
As a general rule , future market direction in my mind is a constant 50/50. But maybe right now I'd go out on a limb and suggest losses are more likely... long-term uptrend seems to have faltered slightly.

I don't see any immediately striking support levels, not until we get down to the 1550's. Just IMO. I analyze the charts like a child would - don't believe it warrants any more than that (just IMO ofc!)
 
great place for shorts to take profit is first 1662. 200 day ma. then When the newbies tried to buy that 1662 today they gaped it at that spot exactly I covered my last short today at 1640 and will wait forJanuary to get long for 30 days ,then Feb can be bearish so will wait to go full boat long in March. Its a cycle that happens year after year after year.
 
Top