Old member first post

dc_ikaruga

Junior member
Messages
10
Likes
0
Hello everyone first post but I have been reading these forums on and off for a while. For purely studious pursuits I have decided to post some of my findings to help further discussion. I have a myspace account which I will be posting pics on regularly as well as this one, you can find it here: MySpace.com - Kin - 29 - Male - UK - www.myspace.com/quotetron

Here are some of my studies over the last few weeks:

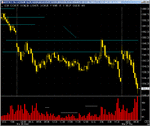
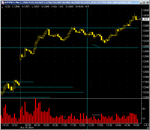
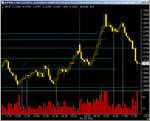
1st pic:

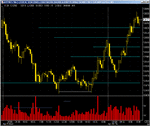
26/03 ES highlights this DB more well than YM. Collapsed within the last hour of trading though. Only to follow through the next week.
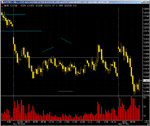
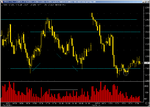
YM for the same day + overnight gap held throughout the day.
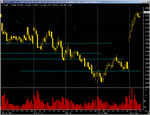
Weak buying followed after breaking past support the rally eventually came after the weekend.

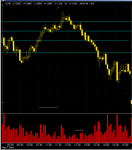
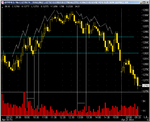
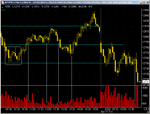
4th pic:
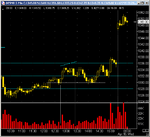
07/04 First rally maybe seen as a 3W Elliot then followed by H&S, CC announcement @ 1400 (1500 EST) Note white lines I have indicated.

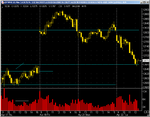
5th:
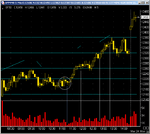
09/04 Notice weak selling on the down followed by a DB. There was some weak buying on the DB too, rally failed over the next few days.
 

Attachments

  • 3.gif
    3.gif
    24.8 KB · Views: 213
  • 4.gif
    4.gif
    25.7 KB · Views: 198
  • 5.gif
    5.gif
    26.6 KB · Views: 194
  • 1.gif
    1.gif
    14.4 KB · Views: 205
  • 2.gif
    2.gif
    25.7 KB · Views: 194
Last edited:
15/04 Weak selling from yesterday opened above resistance but collapsed, potential turning point at circle. I would however be very cautious since buying was up was low volume immediately after and hammers tend show possible reversal.

I think this maybe the turning point for a few days or so, but perhaps another reaction down before another up move. Broke 00's as I type.
 

Attachments

  • 1.png
    1.png
    23.5 KB · Views: 185
De Ja Vu

16/04 This jump reminds me of what I saw on 20/03 I key turning point with signs of weak buying potential failure for this rally, as shown in my last post.

20/03 As you can see a possible H&S which did not follow through only to open high over the long weekend.
 

Attachments

  • 3.png
    3.png
    12.8 KB · Views: 166
  • 4.png
    4.png
    15.3 KB · Views: 162
16/04 Another reaction on weak selling brought us up to 600, there should be more buying up in this rally but the it getting a position may prove more trouble than its worth.

As Livermore once said: Men that are right and can sit tight are very few.
 

Attachments

  • 5.png
    5.png
    15.6 KB · Views: 187
18/04 Buying weakened in the morning but during that first EW. But it was only until after 12 did the market turn.

I actually went short a bit too early just before 10.30
 

Attachments

  • 1.png
    1.png
    19.9 KB · Views: 188
As you can see from 18/04 the market began reacting to the weeks buying.

21/04 Gave us a double bottom which held throughout the day, however moments of weak buying also occured, and today (22/04) the market opened lower and moved down after 10.30. If you look at 15min (17/04)I have hightlighted a period of weak buying, which is more prominent with 5min charts, during midday. I can find no reason to go long at this moment.
 

Attachments

  • a.png
    a.png
    17.6 KB · Views: 1,040
  • b.png
    b.png
    17 KB · Views: 172
23/04 Despite a DB there was weak buying when it was formed.
 

Attachments

  • Ensign.PNG
    Ensign.PNG
    30.9 KB · Views: 1,189
I've been watching your posts since you started the thread. Can you share the market principles that drive your analysis?

Nine
 
I generally follow the principles of supply and demand which can be seen (at least interpreted) through price and volume itself. I usually see a period of weak buying or selling followed by a strong movement in the opposite direction, I try to analysis and plan an entry using a calculated risk and keep my head cool.

Generally this seems to be viable but I have had periods of loss, would you like me to highlight a few examples when I've totally got my ass whooped? LOL
 

Attachments

  • aw.PNG
    aw.PNG
    45.3 KB · Views: 188
Top