and the final one (signal 1 + gauss noise) smoothed. This signal contains two cycles (0.1 HZ + 0.5 HZ)covered by gauss noise. Cycle were not uncovered correctly - but strategy was positive out of sample.
CONCLUSION
For clean signal i was not able to set parameters to extract slow cycle
for gauss noise and gauss noise smoothed i was expecting not to find any cycle - cycles were found.
For combined signal + noise I was expecting to find two cycles, if anybody is able to set
the parameters to extract those two cycles than please post the settings. Fourier analysis of this signal shows cleary two peaks
Trading Strategies Based On Digital Filters - Page 38 - Forex Trading
see post 377
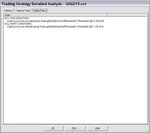
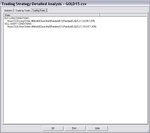
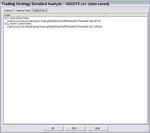
All charts and .csv filest are attached.
Krzysztof
You really want to make CSSA look bad isn’t it? I start to question your real motive behind these posts!
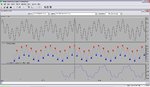
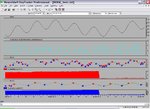
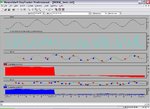
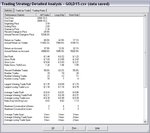
Anyway, I now have added the noise to the signal as you did; so much noise that in fact the signal is very hard to distinguish from (grey line, top chart). As you can see in the graph, CSSA had no trouble finding the two cycles (fast cycle in blue, slow cycle in red).
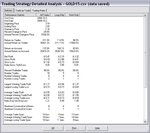
Furthermore, the trading strategy (bottom chart) was 100% successful in exploiting the cycles despite all that noise.
To wrap up:
- CSSA is able to extract all cycles from clean signal,
- CSSA extracts noise from noise which is expected,
- CSSA extracts successfully cycles that are lost in noise.
A last suggestion: please ask questions when needed. I'll be pleased to answer but learn the facts before making false claims that a product does nor work.
Noxa