Hello Krzysztof,
Don’t take it personally but comparative examples such as yours tell me more about the inability of a user to do auto-optimization than the predictive skills of an indicator. If not done properly, the odds favoring good auto-optimization are vanishingly small.
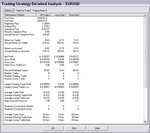
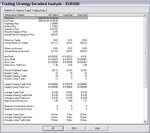
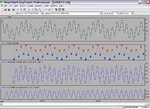
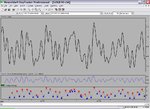
Check out these intraday examples of what you should expect from CSSA:
Noxa Indicators
If there is one piece of advice I could give to non experts, it would be to try to optimize the figure manually first as you suggest. We found it already very useful just to look at the cycles. In fact, if you are an experienced trader, you can just couple them with resistance and support lines and you should be ready for manual trading.
- Try identifying one or two parameters that, when taken in sequence, induce an incremental improvement of your equity line. Identifying such hill in the searching landscape gives a better defined model.
Another suggestion from a fellow user of CSSA:
“ The best way to describe what I do is "time relevance," meaning, if you have a 1-minute bar and you want to see the 1-hour wave, then set the m-Histories to 60. If you want the TrainBars on 1 day of data, then set it to 1439 (I think Phil's first bar is labeled zero) in the 1-minute and set the equivalent in 5 mins, and so forth (but don't forget that currencies have 24-hour data, so do something comparable with other financial issues). There are many variations you can do, but usually, if you stick to making things time-relevant, the appropriate configuration will pop-out for decision-making in that moment or the short time period when you need to make a decision (I usually use this set-up for closing trades manually, especially those caught within news reports). If you do auto-optimization to create trading strategies, I suggest you set all the TrainBars to the same date, time, and equivalent length ”
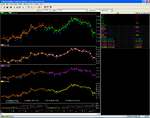
On another note, the strategies in the package might not work for you on finer granularity timeframes; they were crafted for daily charts. But if you get creative, you will find excellent results:
- Trendline has a heavy tendency to trade by countertrend in 1~5-min bars meaning that it crosses below first then crosses above to give a long signal.
- You can also experiment with Flatlines to identify congestive ranges. In your chart example, the market is moving sideways with very little upward and downward movement; these sideways coils are very prone to fakeouts and we all know that escaping a position against a breakout can be expensive.
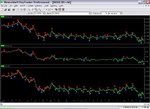
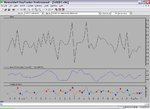
Check out this other example which uses Bollinger Bands with the Flatlines indicator:
http://www.trade2win.com/boards/att...35-noxa-indicators-neuroshell-flatlines-2.gif.
You can use price entry into this range to give up the trade and price exit of either the upper line or lower line from within the range as an on switch to anticipate the breakout.
Related to using Flatlines let me quote a user who posted on NeuroShell’s forum:
“ Remember the old adage about trading breakouts/breakdowns? Never trade the first bar of the breakout or breakdown. Same with cycles, never trade the first cycle that cycles out of the flatline indicator (No matter how huge and tempting the move is. Let's just say I've learned this lesson one too many times!). Wait for the next trough or peak and buy or sell there (or wait for zero if your quadrature phase is shifted). ”
Another piece of trading advice that has been suggested to us by the same author and happens to be consistently true about CSSA: “ look for direction in higher time frames, look for entry/exit in lower time frames. This is an old trading lesson, but you can make money with it using Noxa-CSSA alone! ”
“ It is based on the very old but reliable Alexander Elder's trading system with two or three time frame windows. It's trade-able, if you know the character of the price action of the instrument you are trading. Plot a longer time frame, say a 1-hour bar in a cycle indicator. Plot a shorter time frame, say, 5-min bars with the same cycle indicator. When the 1-hour bar cycle is turned up, trade the 5 min cycles that are turning up. You can try this with Mesa or CSSA (You can also opt to shift the quadrature phase so that the beginning of the up/down cycles is zero). This way, you are actually predicting from the slower movement of the 1-hour bar (the waves) what the momentum of the ripple will be (5-min bars). It is useful to have a trendline of the hourly bars so you can also trade only up 1-hour cycles when the trend is up (the tide, a-la John Ehlers). Although range traders like me work with a lot of cycles, it always pays to take a peek at your trendlines and your retracements. For example, take a look at the very sharp drop (almost 500 pips in 1 hour and 15 mins) in EURJPY at 10AM today (10/21). Although you can't trade that with cycles, you can trade the retracement with one, easily picking the bottoms and tops of the retracement with a smaller time period starting at 10:15 AM, where the conditions are once more amenable to cycle analysis. ”
Hope this helps.
Noxa
