Never trade against the Trend ?

StmChris

Newbie
Messages
4
Likes
0
Hi,

I read that we do not trade against the trend.

I would like to know if a stock chart is downtrending let's say from $30, and the stock is up (let's say 8%) since the Opening of the Market, it is a good thing to short the stock ? and vice versa ?

Thanks for your returns.
 
Hi,

I read that we do not trade against the trend.

I would like to know if a stock chart is downtrending
Thanks for your returns.

Firstly your question is poorly framed and so I will only be addressing it from the standpoint of the portion of your question that I have quoted. I am assuming we both are using the same definition of a down trend i.e. a series of lower highs and lower lows.

Typically in positioning to trade down trends there are two approaches, short rallies or breakdowns. Your question is basically where to position the short. There are some guidelines that I can offer but the overriding piece must be understood in the context of the overall market structure of the stock in which you wish to short.

Basically you would want to position your short where the rally is likely to run out of steam and would be places where supply will reappear or at price points of resistance. You can use dynamic resistance like fibonacci levels, moving averages or upper channel lines. Conversely you can attempt to identify static resistance points like prior breakdown points, or prior pivot levels. You need to apply judgment based on your read of the market structure and is not simply some formula based rules. For example, a 4th wave rally retracement depth is very different from a 2nd wave retracement. The probabilities are significantly different. You also need to understand whether you are shorting into an exhaustion rally or continuation rally. The trend end on the former. You should also apply the "Gann rule". Any rally that exceeds in price and time over the previous rallies would likely suggest the prevailing trend is likely transforming into some kind of non trending structure. T

Bottom line is you should not be shorting based on some kind of formula. Trading is both art and science.
 
Trading is both art and science.

Internet trading is not science. Science requires observe-ability and reproduce-ability. Nearly everyone claiming to be traders here, at the minimum, cannot even be observed to be trading. Some claim their pet bigfoot living in their shed does not permit showing of their trading.
 
Internet trading is not science. Science requires observe-ability and reproduce-ability. Nearly everyone claiming to be traders here, at the minimum, cannot even be observed to be trading. Some claim their pet bigfoot living in their shed does not permit showing of their trading.

I assume you are referring to me with you "Bigfoot"coments, I agree with some of Brumbys comments. TA just doesn't happen, it has to be understood, observed, tweaked, tested backward and forward. Every trade I take is a mirror image of the conditions, every trade has a set stop, a set limit, its ability to "re-produce" as you state is extremely high. The conditions of every trade are the same, therefore the data I draw from that makes my statistical data very accurate and I can enter trades safe in the knowledge I will be successful.

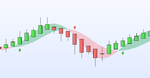
There are many ways to define a trend, even more than Brumby identified, its up to you to use what you feel comfortable with, what you have studied, observed and implemented.

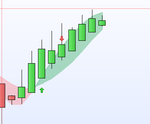
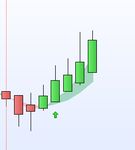
What ever you use, the key IMHO is PA, it drives everything, understand that and add in some TA to back it up, if its all repetitious and mirrored, generally your on a winning formula.

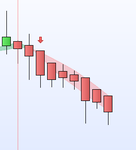
As much as it seems you want people to give you their trading systems, you will be out of luck, hard work is what is required, follow the price and follow the price trend.
 
I can enter trades safe in the knowledge I will be successful.

Go on then enter one and be successful. There's no way for anyone to deduce what you do from one trade. I have no interest on your "system", what I am interested is evidence of your trading.

Brumby said no results could be reproduced by people using the same strategy. So he contradicts himself with regard to science.

Don't feel personal about it. My reference to bigfoot is for all the bigfoot tamers out there. There are plenty. I too have a bigfoot in shed. I caught him the other day. I baited him with colourful moving averages and he fell for it.
 
Next to some other plebs in the markets sheds, this is rank amateur. You might wana keep the door closed.
6099-darktone-albums-joes-dope-moves-picture5066-joes-shed.jpg
 
no results could be reproduced by people using the same strategy. So he contradicts himself with regard to science.

Really? are you sure, spot the repetitious PA pattern?, whoops, it shouldn't happen, but a reality check for you Joe, it does, you just need to know what you are doing backed up by 15 years full time experience as a trader.
 

Attachments

  • T2W.png
    T2W.png
    12.9 KB · Views: 453
Using the above Jo, the USD?JPN you traded, green arrow (notice the pattern) where an entry long should have being taken, the red arrow is where you went short.
 

Attachments

  • USDJPN.png
    USDJPN.png
    7 KB · Views: 465
Jo, you said it can't happen, whoops, happening right now on EURUSD and USDCAD, spot the pattern
 

Attachments

  • EURUSD.png
    EURUSD.png
    4.7 KB · Views: 452
  • USDCAD.png
    USDCAD.png
    3.7 KB · Views: 433
Interesting charts Dinos, what are we actually looking at indicator wise? I'm guessing HA bars and a coloured zone between 2 MA's?
 
Jo, you said it can't happen, whoops, happening right now on EURUSD and USDCAD, spot the pattern
Dino, a change of HA candle color can show up anywhere only to be followed by a return to previous color, and trend. I don't see the reliable entry in those charts you posted? Would you clarify to this dummy? :)
 
Interesting charts Dinos, what are we actually looking at indicator wise? I'm guessing HA bars and a coloured zone between 2 MA's?

Correct HA bars, chart is PA from 3 time frames slow, medium and fast, PRT wrote me a bespoke set up, that allows me to select the upper and lower time frames and set as a zone, trading off the HA candles is the medium PA, into the zone where both the slower and faster PA is established. Pattern trading the HA is a critical component. Hope that makes sense.
 
Dino, a change of HA candle color can show up anywhere only to be followed by a return to previous color, and trend. I don't see the reliable entry in those charts you posted? Would you clarify to this dummy? :)

With all due respect, No, please read up on HA candles and their operation, ther's plenty of info on the net. :)
 
Using the above Jo, the USD?JPN you traded, green arrow (notice the pattern) where an entry long should have being taken, the red arrow is where you went short.

Gosh , that is a dumb place to go short , I mean if you're trading withoout a stoploss then your at least your entry points have got to be sharp.
 
Top