As we end 2011 the Eurozone debt crisis has taken centre stage. Even for the most hardened technical trader it has been difficult to ignore the fundamental noise emanating from Brussels.
This reached fever pitch after the EU summit on 8-9th December was deemed a massive failure. So as we enter a New Year, traders who want to keep their profits need to get used to fusing fundamental and technical analysis when they trade the markets.
For example, EURUSD dipped below 1.30 on 14th December. This was a huge move since it was the lowest level for the single currency for 11 months. 1.30 was like the Rubicon for the FX market – it was considered a point of no return. Not only was it of major technical importance but it also had fundamental influence; once the euro dipped below this level it suggested a couple of things: 1, the debt crisis had escalated and 2, that market sentiment towards euro-based assets had taken another turn for the worse.
This is fundo-technical analysis in action, which makes up the basis of my philosophy for analysing markets: fundamentals determine the medium-term trend, while the technicals point to shorter-term price movements. For most retail FX traders it’s the short-term movements where you make or lose money. Thus, although you may know all about the weak outlook for the currency bloc and the fact that Italian bond yields are surging this means nothing to you because you can’t make profits from this information alone.
Hence the question on every good trader’s lips is “what now?” Since we are at such an important level for EURUSD I have decided to look at point and figure charts to see if there are any key support levels that jump out at me. I like using point and figure when we get below these key levels because it strips out the noise in the market. Usually around big moves prices can become sticky as traders get nervous about breaching such a key support zone. Thus, prices can move up and done like a yo-yo and you risk firstly losing your nerve that you made the right trade and secondly, getting taken out by the whipsaw price action.
So, if you think that EURUSD is going lower then point and figure (“P&F”) charts are a good way to pick significant support and resistance levels since P&F charts strip out time – they only show you price. As you can see in the chart below, the next key level to watch is 1.2900, below here opens the way to 1.2600 and then we are back to the sub-1.20 lows from the peak of the Greek crisis back in mid-2010.
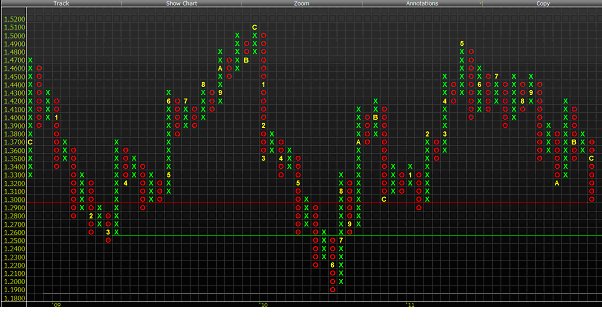
Source: Bloomberg
So what are the future fundamental and technical risks that could impact the currency’s movement from here?
Looking at the fundamental factors first, Italy has EUR 112 billion of debt to auction in the first three months of next year, the EU authorities have so far failed to come up with more money for the bailout fund and the currency bloc is expected to experience a mild recession in the first six months of 2012. So from a fundamental standpoint the outlook is fairly gloomy.
But what does the euro’s technical history tell us about where the pair might go? On a very long –term basis the euro is actually fairly strong within its range. Back in 2001 EURUSD was trading at 0.85. But since 2002 (with a little help from global central banks to get going) the euro has been on a long-term up-trend. In the medium-term after peaking at 1.60 in 2008, the pair has been stuck in a range between 1.50 to 1.19 – the July 2010 low.
The break below 1.30 is significant not just because it is one of the lowest levels in this pair for nearly a year, but also because it opens the way to 1.20. This is a level that hasn’t been convincingly breached since 2005. When it broke below 1.20 back in July 2010 it didn’t last long and the single currency soon bounced back. This is a major support level and it also coincides with the 200-week moving average.
So, if we are to see EURUSD fall below this level then something serious is going on. Perhaps a failed Italian debt auction, a disorderly Greek default or even a break-up for the currency bloc could be triggers. While all of these events are possible no one can predict with any certainty when they might happen. Also, because they would also be first-time-ever type of events then it is difficult to know how to price in the probability of them happening with any type of accuracy.
Interestingly, the average EURUSD rate since 2000 is 1.2425, according to Bloomberg data. And in the current environment where the politicians seem to have the will to save the Eurozone although they lack the way out of this crisis, we could see this pair meander back to the mid-1.20’s over the next few months if sentiment does not change.
But we can’t forget that the euro is a strange currency, it can prove very resilient and in recent months it has not declined in a straight line. So traders beware. All of the fundamental and technical analysis in the world can’t protect you from unusual moves in the market and if you trade euro then your trading plan needs some contingency built into it to account for central bank and petro-dollar reserve diversification, which tends to be euro positive.
So traders, if you are hooked on the news coming out of Europe and think it will end badly, don’t think the euro will follow suit. Short-termism is the name of the game when it comes to the single currency and it could be more like death from a thousand cuts than an outright collapse.
Kathleen Brooks can be contacted at Forex.com
This reached fever pitch after the EU summit on 8-9th December was deemed a massive failure. So as we enter a New Year, traders who want to keep their profits need to get used to fusing fundamental and technical analysis when they trade the markets.
For example, EURUSD dipped below 1.30 on 14th December. This was a huge move since it was the lowest level for the single currency for 11 months. 1.30 was like the Rubicon for the FX market – it was considered a point of no return. Not only was it of major technical importance but it also had fundamental influence; once the euro dipped below this level it suggested a couple of things: 1, the debt crisis had escalated and 2, that market sentiment towards euro-based assets had taken another turn for the worse.
This is fundo-technical analysis in action, which makes up the basis of my philosophy for analysing markets: fundamentals determine the medium-term trend, while the technicals point to shorter-term price movements. For most retail FX traders it’s the short-term movements where you make or lose money. Thus, although you may know all about the weak outlook for the currency bloc and the fact that Italian bond yields are surging this means nothing to you because you can’t make profits from this information alone.
Hence the question on every good trader’s lips is “what now?” Since we are at such an important level for EURUSD I have decided to look at point and figure charts to see if there are any key support levels that jump out at me. I like using point and figure when we get below these key levels because it strips out the noise in the market. Usually around big moves prices can become sticky as traders get nervous about breaching such a key support zone. Thus, prices can move up and done like a yo-yo and you risk firstly losing your nerve that you made the right trade and secondly, getting taken out by the whipsaw price action.
So, if you think that EURUSD is going lower then point and figure (“P&F”) charts are a good way to pick significant support and resistance levels since P&F charts strip out time – they only show you price. As you can see in the chart below, the next key level to watch is 1.2900, below here opens the way to 1.2600 and then we are back to the sub-1.20 lows from the peak of the Greek crisis back in mid-2010.
Source: Bloomberg
So what are the future fundamental and technical risks that could impact the currency’s movement from here?
Looking at the fundamental factors first, Italy has EUR 112 billion of debt to auction in the first three months of next year, the EU authorities have so far failed to come up with more money for the bailout fund and the currency bloc is expected to experience a mild recession in the first six months of 2012. So from a fundamental standpoint the outlook is fairly gloomy.
But what does the euro’s technical history tell us about where the pair might go? On a very long –term basis the euro is actually fairly strong within its range. Back in 2001 EURUSD was trading at 0.85. But since 2002 (with a little help from global central banks to get going) the euro has been on a long-term up-trend. In the medium-term after peaking at 1.60 in 2008, the pair has been stuck in a range between 1.50 to 1.19 – the July 2010 low.
The break below 1.30 is significant not just because it is one of the lowest levels in this pair for nearly a year, but also because it opens the way to 1.20. This is a level that hasn’t been convincingly breached since 2005. When it broke below 1.20 back in July 2010 it didn’t last long and the single currency soon bounced back. This is a major support level and it also coincides with the 200-week moving average.
So, if we are to see EURUSD fall below this level then something serious is going on. Perhaps a failed Italian debt auction, a disorderly Greek default or even a break-up for the currency bloc could be triggers. While all of these events are possible no one can predict with any certainty when they might happen. Also, because they would also be first-time-ever type of events then it is difficult to know how to price in the probability of them happening with any type of accuracy.
Interestingly, the average EURUSD rate since 2000 is 1.2425, according to Bloomberg data. And in the current environment where the politicians seem to have the will to save the Eurozone although they lack the way out of this crisis, we could see this pair meander back to the mid-1.20’s over the next few months if sentiment does not change.
But we can’t forget that the euro is a strange currency, it can prove very resilient and in recent months it has not declined in a straight line. So traders beware. All of the fundamental and technical analysis in the world can’t protect you from unusual moves in the market and if you trade euro then your trading plan needs some contingency built into it to account for central bank and petro-dollar reserve diversification, which tends to be euro positive.
So traders, if you are hooked on the news coming out of Europe and think it will end badly, don’t think the euro will follow suit. Short-termism is the name of the game when it comes to the single currency and it could be more like death from a thousand cuts than an outright collapse.
Kathleen Brooks can be contacted at Forex.com
Last edited by a moderator: