tradesmart
Experienced member
- Messages
- 1,286
- Likes
- 22
Soros buys in....?
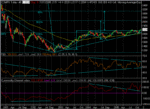
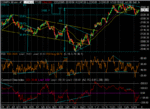
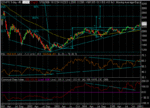
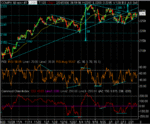
It seems increasingly clear that barring an unforeseen reversal, the Naz is breaking out from it’s long flat trading range and the rising tide could lift a lot of tech ‘boats’ that have been distrusted/trashed in recent years – particularly the big names like INTC/AMZN/EBAY/MSFT/AAPL….
(I cite these as I’ve heard that Soros has bought in…… 😉 )
Thanks to Alfine for the Soros article....
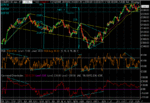
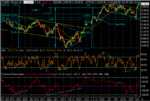
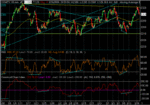