Nasdaq Comp Gaps and Reversals Thread

I did not mean to offend. I did not know I had to post charts on your thread. No need to yell. All you have to do is ask. You know..... words can hurt.

Great post TGM - In fact I was 'whispering' and there is no "hurt" intended in the style....I'll add more later - still watching indices/stocks in which I have an interest..... :cheesy:

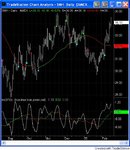
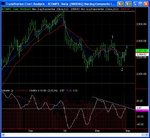
More - Today's action has obviously confirmed the Dow's strength with a new year high, but I note that the Naz has made a greater day percentage gain though still slightly below the recent highs - I suspect that any pullback now is going to be quite shallow, underpinned by the generally bullish year end sentiment in the market - we'll see..

Regards......
 
Last edited:
The “bump and run” setup followed in several posts above eventually delivered bigtime, but some patience was needed to allow the 4-wave top to develop…! (I look for 3-waves normally….!!)

Looks like a bottom has formed now at the lead-in support line for some sort of bounce or maybe another attack on the highs….
 

Attachments

  • 19-01-05.gif
    19-01-05.gif
    21.5 KB · Views: 281
Premature mention of ‘support’ above, but it was undoubtedly showing signs of forming, but did not have the power to deliver……

When support failed at a touch of the lower trendline from the underside as resistance (in this timeframe) it clearly provoked a further burst of selling resulting in a decisive break south and a big gap….

However once again support has apparently been found at just above the crucial 2000 level as is evident by a plain divergent RSI bottom, and at around the 38.2 fib retracement level of the rise from the August lows to the December highs….

A break north from the well defined downtrend channel will offer an immediate target of 2120 imho, which is about the 61.8% retracement level of the January falls….

In the speculative longer term, that peak at 2190 looks kinda lonely, and we very often see ‘lone peaks’ become ‘twin peaks’……..!……… :D

Ps for anyone who is interested in trading these moves, the QQQQ Nasdaq Comp tracking stock follows an almost identical chart profile (formerly QQQ)
 

Attachments

  • 31-01-05.gif
    31-01-05.gif
    24.8 KB · Views: 260
I suspected that we might have an Island Reversal in the making with two unfilled gaps, and it still might qualify, as the later developing bear flag downside target was met without fully filling the gap – a bullish sign imho….

In fact, despite the Naz’s slightly erratic performance lately; underperforming the blue chips – I believe that the underlying tone is bullish and we could still retest the recent highs shortly.

Fat finger day today:-
Traders attributed an intraday dip in the market to speculation of an input error in the Nasdaq 100 tracking stock, better known as the quadruple 'Q's
 

Attachments

  • 15-02-05.gif
    15-02-05.gif
    27.6 KB · Views: 233
Last edited:
I agree with you tradesmart cuz every trader I talk to is bearish the Naz. If you look at the Semiconductors they are really starting to catch the bids and they were the dogs (bargain hunting??).

Intra-day, I have noticed the SOX getting stronger and stronger over the past couple weeks. Here is a chart of the semiconductor holders. I have noticed over the years the semis rally and then the nasdaq rallies. We will see soon enough.

Of course, we could always petition the Nasdaq to increase the Nasdaq 100 weightings for Apple from 3.7 percent to about 7 percent. While we are at it. Tell them to go ahead and throw in my new baby Google at about a 4% weighting or so (you know they are salivating to include Goog)! Get'em moving one way or another! ;)

Now that every stock market in the world is being bid up (the ftse is on fire) and that means the traders will be looking for something cheap to buy. Since the Nasdaq is the "cheapest" they will look to bid it up next.

I learned a long time ago that anything logical is overrated when it comes to stocks. The above is an brief introduction to what I call "meathead logic". The logic that prevails in the stock market. Nothing like using a little meathead logic and technicals to figure out the action. It is the only thing that works for me. :cheesy:
 

Attachments

  • smh.jpg
    smh.jpg
    79.5 KB · Views: 232
Great post TGM….as a leading devotee of “meathead logic”, here’s some ‘bull’ from me…..

After an uninspiring performance of late since the highs at the end of ’04, maybe the subtle signs of a turnaround are apparent…

The Naz has kept a foothold above 2000, and may be in the process of forming a loose ‘W’ bottom as shown on the 60min chart, and a surge north of the apex 2100 will confirm this…the target is very close to the recent highs…

In support, techs have started to lead the way up on talk of an imminent broker upgrade for the sector; and yesterday, gains in semiconductor stocks helped overcome concerns about the rising price of oil (some feat!)

Tobias Levkovich, US equity strategist at Smith Barney, said in a research note that, in spite of investor concerns about the broader market, semiconductors and IT stocks appeared set for an improved performance this year.
The 5 day chart shows that the Naz is making an apparently bullish ascending triangle, with the c.900 height aligning with fibonacci retracement targets relative to the 5100 all time high in early 2000.
 

Attachments

  • 25-02-05.gif
    25-02-05.gif
    27.7 KB · Views: 210
  • 25-02-05a.gif
    25-02-05a.gif
    28.8 KB · Views: 204
Just an update on the Naz’s progress from what I perceive as ‘support’ and the daily chart shows this quite clearly imho…..

As mentioned above, potentially a ‘W’ bottom reversal, and the dimensions hint at a retest of the recent high at 2190 ish….

Anybody got a chart to show a bearish perspective..? – it’s important that we consider the possibilities from all angles….

(normally up, down or sideways….. ;) )
 

Attachments

  • 01-03-05.gif
    01-03-05.gif
    21.8 KB · Views: 224
tradesmart said:
Anybody got a chart to show a bearish perspective..? – it’s important that we consider the possibilities from all angles….

Here is a possible scenario on the daily chart...

1-2-3 Formation
3-10-16 Oscillator downtrend
MAs showing downtrend by their position to each other (5, 10 & 20 EMA)
 

Attachments

  • Nasdaq-Comp-01-03-05.jpg
    Nasdaq-Comp-01-03-05.jpg
    81.7 KB · Views: 221
From my three lines standpoint ardhill has it right. The problem is simply "meathead logic" will prevail. The traders will say "oh gee how cheap ---lets buy the nazdoggies!!" and all the traders will jump in (yours truly included).

Ardhill, good job reading the lines. But one warning. No other market will defy bearish line patterns like the stock market. The nazdaq should have gotten killed out of this line pattern and it survived. I have seen this many times!

Now time works against the bears. As long as the Naz sits here or higher we will start turning the lines into bullish status. The window of opportunity for a selloff has worn off and the rest of the market is ON FIRE. The SOX are on a tirade.


Good post TradeSmart! Way to stay true to your name! Are you Scottish or Irish?

TGM
 
I think she's Manx, bless her. No tail, yet still achieves near perfect balance - amazing :)

*frugi dons military spec protective flame suit*
 
TGM said:
From my three lines standpoint ardhill has it right. The problem is simply "meathead logic" will prevail. The traders will say "oh gee how cheap ---lets buy the nazdoggies!!" and all the traders will jump in (yours truly included).

Linda Bradford Raschke has a dog called Nazdoggie, I wonder is she is going long too :)
http://www.lbrgroup.com/images/nazdoggie.vs.sara.jpg


Ardhill, good job reading the lines. But one warning. No other market will defy bearish line patterns like the stock market. The NASDAQ should have gotten killed out of this line pattern and it survived. I have seen this many times!

Aha, but I have a secret trading strategy up my sleeve...

I am not backing the Naz to go down - nor up.
I simply back the strong or weak stocks in their respective directions, so I am not too concerned. But I must admit, I have taken more short trades lately on the Naz. But, I have taken winning trades to the upside too, or were they on the NYSE?

So, I am a bear, no a bull, no ... Come on you winners!
 
Thanks for that bears-eye view Ardhill……

However, the bulls are now asserting themselves on proceedings bigtime, with a nice triangle breakout north today with an immediate target of c.2120 imho

TGM – IOM=Isle of Man – in the middle of the Irish Sea between Ireland and Scotland, so you were nearly right…..!

ps - TXN/STX are reporting after the bell today, and INTC on Thursday - I suspect that the market is anticipating good news......
 

Attachments

  • 07-03-05.gif
    07-03-05.gif
    23.3 KB · Views: 235
Last edited:
And the bears eye view today says...

Hmmm, the Nas is looking decidedly bullish, and as for the Dow and S&P, I had better get my red cloak out for them :)
 
tradesmart said:
Thanks for that bears-eye view Ardhill……

However, the bulls are now asserting themselves on proceedings bigtime, with a nice triangle breakout north today with an immediate target of c.2120 imho

TGM – IOM=Isle of Man – in the middle of the Irish Sea between Ireland and Scotland, so you were nearly right…..!

ps - TXN/STX are reporting after the bell today, and INTC on Thursday - I suspect that the market is anticipating good news......


I agree. Markets move fundamentals follow. I am guessing we have a few surprises in store. Bear rugs in the making! Meathead logic at it's finest!

Oh and "Close" counts!!! Especially when it comes to Horseshoes, Hand Grenades and Islands caught between Ireland and Scotland! :cheesy:

Here is a pic. My 3 lines gave a BIG buy signal and it should be significant because the last sell signal was a dud. Momentum clearly with the bulls.
 

Attachments

  • naz.jpg
    naz.jpg
    57.9 KB · Views: 303
Tradesmart,

Is this a Baby Bump and Run in the ER2?

This is a 144 tick chart and the larger time frames are consolidating a rally. I trade this market all the time anymore. The ER2 moves quite well.
 

Attachments

  • er2.jpg
    er2.jpg
    49.5 KB · Views: 286
Today is the 5th anniversary of the day that the NASDAQ hit its peak, of 5,163......!

But such has been the deflation of the tech bubble that it hasn't even been able to recoup half its losses yet......

INTC is reporting after the bell today, and with semis apparently being the flavour of the month just now; it might help the Naz to break 2100..

I suspect that it wants to play catch up to the other indexes....

Is this a Baby Bump and Run in the ER2?
TGM - it looks a bit strange with the 'run' exceeding the 'bump' but certainly looks poised for a retracement north now......

More later.....

More:-
Intel lifts low end of Q1 sales target
SAN FRANCISCO -- Intel Corp. (INTC) , the world's largest chipmaker, raised the low end of its first-quarter sales forecast to between $9.2 billion and $9.4 billion, compared to the previous range of $8.8 billion to $9.4 billion. It also lifted its gross margin forecast to 57 percent, higher than the 55 percent it had previously forecasted. Ahead of the update, shares of Intel closed at $24.85, up 1 cent.
INTC shares now $25.43 aftermarket - maybe this will be be the boost the Naz needs for a break to the upside......we'll see...
 
Last edited:
The Nazdaq should have had some follow through to the upside ---now the whole market feels like it is heading to hell. I have been on all sides of this one. But feel you have to be short now. All the indexes are feeling like they are going to jump out the window. This next downleg in the indexes (basis the weekly, monthly charts) could be the one your mother warned you about.


Tradesmart,

Thanks for posting the date.
 
This next downleg in the indexes (basis the weekly, monthly charts) could be the one your mother warned you about.

Very true TGM

Any bullish speculation on hold for now as the Naz hit it’s year low on Friday, the price flickering below 2000 at one point, and the trading range is clearly defined between 2000 and 2100……

But with a PD bottom showing on RSI/CCI some sort of minor bounce is very likely, but the index will not show strength unless it can break the 2100 resistance barrier, which will target the year highs at just under 2200, but a break through 2000 will target 1900 imho…

Apparently hedge funds have been selling out of Nasdaq stocks all year and buying energy and commodities, but if oil etc has peaked short term (big ‘if’…!) maybe the trend will be reversed – there is currently plenty of positive speculative comment regarding the growth potential of Net stocks…

Let’s see if 2000 holds…. :confused:
 

Attachments

  • 21-03-05.gif
    21-03-05.gif
    31.2 KB · Views: 222
Let’s see if 2000 holds…. :confused:

Well no, but no level is definitive, and further clues have appeared…….

Following a 3month descent from the December highs the Naz has reached the 50% fib retracement level of the rise from the August lows and a divergent bottom on RSI/CCI may be signalling the start of an upleg........

The first target is to break the upper trendline at 2060ish imho which may lead to a test of resistance at 2100……..

The 150 point channel height hints at an ultimate retest of the recent highs at c.2190.....
 

Attachments

  • 05-04-05.gif
    05-04-05.gif
    30 KB · Views: 227
Last edited:
the short to end all shorts....?

From the April post above:-

The 150 point channel height hints at an ultimate retest of the recent highs at c.2190.....
Well, hindsight now confirms that it did get to 2190 and beyond……nice to know that the t/a works…..!

I’ve posted the Naz 5-day chart on this thread before (post #86) and another wave has developed within the big (bull…?) triangle and appears poised for a significant breakout targeting c.3120 imho; the 50% Fibonacci retracement of the huge drop from the 2000 highs…..

The chart highlights how little relative progress the Naz has made in 5 years… :confused:

But it was the 'short to end all shorts'......!..... :cool:
 

Attachments

  • 11-11-05.gif
    11-11-05.gif
    32 KB · Views: 215
Top