Nasdaq Comp Gaps and Reversals Thread

Hi Tradesmart

tradesmart said:
However, the Naz, like the other indices, looking ever so slightly overbought just now, and with a divergent RSI ‘top’ on the radar and two unfilled gaps under; will be watching for some sort of retracement very soon…..

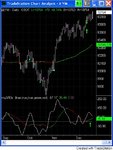
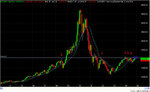
I have just been looking at this on the Nasdaq composite. Have a look at the restance it is bouncing off, It may well be in for a tanking just as you say... maybe.
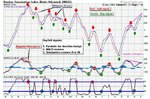
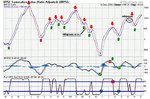
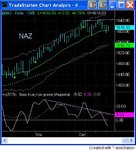
 

Attachments

  • Monthly-Nasdaq-Comp.jpg
    Monthly-Nasdaq-Comp.jpg
    73.3 KB · Views: 281
  • Daily-Nasdaq-Comp.jpg
    Daily-Nasdaq-Comp.jpg
    88.8 KB · Views: 240
Last edited:
Nice charts Ardhill, and the price action this week has demonstrated that previous resistance levels count for very little when the superbulls are driving the market…

The 60 min chart is showing the price pulling back minimally on RSI ND and RSI PD support is occurring a very high (relative) level and gaps are being left unfilled (for now..!)……all supremely bullish….!

I reckon the Naz wont stop now until it has at least equalled the year high from January at around 2150 – not that far off now….. :cool:
 

Attachments

  • 12-11-04.gif
    12-11-04.gif
    22.3 KB · Views: 269
Quite a classic potential bump and run setup on the Naz with the lead-in and bump phases in place and all we need now is the ‘run’ with a break of the supportive but very steep lower trendline, to signal some degree of retracement; but maybe it will want to test the year high at 2150 ish before this happens. But even then, with such bullish sentiment currently, any pullback may be quite mild…

(that said knowing that ‘sentiment’ can do a handbrake turn at any time….. :cheesy: )
 

Attachments

  • 19-11-04.gif
    19-11-04.gif
    27.5 KB · Views: 267
So,

Might the SuperBulls have crashed and burned?

Maybe, possibly?
 

Attachments

  • Crashing SuperBull.jpg
    Crashing SuperBull.jpg
    16.4 KB · Views: 237
SuperBalls don’t give up easy……!

Is that a bull flag I see signalling a possible return to test former support at 2090 as resistance….?

"knowing that ‘sentiment’ can do a handbrake turn at any time"

hey man, I got it right.......!......... :cheesy:
 

Attachments

  • 19-11-04a.gif
    19-11-04a.gif
    17.3 KB · Views: 272
Well, the ‘bump and run’ setup is developing nicely and as mentioned above, 2090 was tested as resistance today, which resulted in a sharp reversal off that level….

However, bull markets don’t give way that easily and in the second part of the session we had another surge north (almost a ‘round trip’) from trendline support to test the top line of the apparent triangle that has formed….

CCI seems to be forming a bottom with PD on RSI, which suggests that the bulls may want to test the recent highs again…...... :cool:
 

Attachments

  • 23-11-04.gif
    23-11-04.gif
    23.7 KB · Views: 282
As suggested above, the bulls tested to within a couple of points of the recent 2112 high today, and having developed an ND top on RSI, the index predictably slipped slowly south to close marginally in the red.

Red could be the shade of things to come very shortly, as the Naz has a 5-point gap to fill between 2090-85…..
 

Attachments

  • 26-11-04.gif
    26-11-04.gif
    23.1 KB · Views: 263
Red could be the shade of things to come very shortly, as the Naz has a 5-point gap to fill between 2090-85…..

Well, the red was minimal and the gap has gone unfilled for now, such has been the Naz’s bullish urge to equal the year high at around 2150 ish which has been achieved today and a selloff from that level is now underway…..

Watching to see where support forms, and how long it takes the bulls to regroup for another attack on 2150…….

edit - 21.42 - Intels' 4th quarter sales update after the bell seems favourable and has boosted the futs, so maybe we'll see another surge to the upside tomorrow..... :cool:
 

Attachments

  • 02-12-04.gif
    02-12-04.gif
    24.5 KB · Views: 240
Last edited:
As predicted above, the Naz surged to the upside Friday on the Intel news, and in the process produced a year high at 2164; but has now reversed quite sharply off the higher levels resulting in today’s minor tank…

A potential bump and run setup in a shorter timeframe was noted a few posts ago, but the 4hr chart shows an absolute classic pending a break of the steep ‘bump’ support trendline that may produce the 'run' retracement phase.

Some commentators have suggested a possible ‘Santa’ Rally, but he may have arrived early this year imho…

Still, the bulls might have something left – let’s see……. :cool:
 

Attachments

  • 07-12-04.gif
    07-12-04.gif
    18.5 KB · Views: 229
Last edited:
Didn´t know where to dump these charts (produced by a good female(!) poster)
(NASI) Nasdaq; Bulls ain´t dead yet!?
(NYSI) NYSE; Bears in controll?
 

Attachments

  • nasi.jpg
    nasi.jpg
    110.5 KB · Views: 270
  • nysi.jpg
    nysi.jpg
    102.7 KB · Views: 240
Didn´t know where to dump these charts (produced by a good female(!) poster)

Interesting insight into Svensk humour Max…….

ROTFLMAO……!......... :LOL:

Couldn’t you have found a dumpster….. :confused:

Anyway….

Still, the bulls might have something left

They certainly had and today’s bullish action taking the Naz back up to the highs – last chance for the bump and run setup to deliver if the index pulls back decisively from resistance in the 2160 area imho…......
 

Attachments

  • 14-12-04.gif
    14-12-04.gif
    18.9 KB · Views: 245
  • Like
Reactions: TGM
This sucks as well as many other things!?? Bull% topping and falling? Can´t see any sustainable rally before Feb/March in this index? Rug pulling contest between the MM´s 1st trading day after Christmas? :devilish:

many lines as usual :)
 

Attachments

  • ndx.gif
    ndx.gif
    33.2 KB · Views: 215
tradesmart said:
Interesting insight into Svensk humour Max…….

ROTFLMAO……!......... :LOL:

Couldn’t you have found a dumpster….. :confused:

Anyway….


They certainly had and today’s bullish action taking the Naz back up to the highs – last chance for the bump and run setup to deliver if the index pulls back decisively from resistance in the 2160 area imho…......

backtest of TL as I see it - some call it a kiss of death :devilish:
 
Hi all,
All these wonderful charts.. please tell me which site/s you are using. I have not seen anything like this.
Thanks for the help.
Heather
 
I stole that chart and just added some lines on it - :devilish:

Guess it´s from Stockcharts but not sure - I use Quote.com for US-stocks and indices or FT
/Max
 
Here´s a killer! The monthly chart of Naz Composite is screaming sell! Major correction ahead. P/C-ratio way to low. No need for any rally caps until the autumn! Taking cover is one option.. :devilish:
 

Attachments

  • 0NasdaqComp.gif
    0NasdaqComp.gif
    17.5 KB · Views: 215
More bearish Pain from Max………!

Do any bears live in the woods near you….?….you may be coming under their influence ;)

Nevertheless I agree that the short term view is certainly bearish with the 4 hr chart showing that the bump and run setup identified in potential form two weeks ago is now delivering the ‘run’ phase to the downside in classic form and RSI/CCI has yet to show any sign of a bottom..

However the big picture on the 5-day chart is showing that now the Naz has broken to the north of the 10month long consolidation, the potential target could be in the vicinity of 2670, which is around the 38.2% fib retracement level of the massive fall from the early 2000 highs to the 2003 lows.

ps - Hevmic - I use SierraCharts
 

Attachments

  • 21-12-04.gif
    21-12-04.gif
    21.2 KB · Views: 216
  • 21-12-04a.gif
    21-12-04a.gif
    26.5 KB · Views: 169
The NasCrack is trading down because of the new laws requiring them to expense options. Companies in the Naz have been "bumping" and "running" their shareholders. They now have to pay the piper. Of course the rest of the market looks good to me (Dow, ER2, Spoo). BTY, I am talking my position.

MaxPain,

I have found that stocks have to have TONS of bearish sentiment/indicators for quite a while before that brings down the market. Damn the river when it floods not before. I try to 'tradesmart'.


TGM
 
Damn the river when it floods not before. I try to 'tradesmart'.
TGM

Interesting assertions tinged with melodrama and lacking technical basis which is not very smart at all…..!

Can you please post some charts/other evidence to back-up the gobsh*te…..?

Thanks…..
 
Last edited:
Easy Killer

Tradesmart,

I did not mean to offend. I did not know I had to post charts on your thread. No need to yell. All you have to do is ask. You know..... words can hurt.

Technical basis YM:

The trend is up basis the 49 day moving average. My SL is ready for a fresh flip up (white Oscillator =SL). The ML (dotted colour change indicator overlayed on the SL) is in position to sustain an up trend. Looks to be a classic bull flag. I cannot remember ever getting five days in a row to sell at or near a stock market top. Of course, as I stated. I am long. However, it has to keep pushing higher to keep me long.

Technical basis Nasdaq (I am showing the chart for the mini Nasdaq 100):

We had a cutesy little double top. This happened with the news that Companies had to expense options. This is an against the trend news related move. I give very little weight to them. The technical picture looked very bearish with several lower highs in the SL and a downtrend starting in the ML. However, in a strong stock market these rarely go far or last long (usually just to the 20xma---the green line the market resting on). The ML is in a down cycle and essentially going flat ready to turn up with any price strength. With the SL low and the trend still up. I would have to buy this. But I am sticking with the stronger markets like the YM.

" Damn the river when it floods not before. I try to 'tradesmart'." I was simply agreeing with your earlier posts about the "superbull". In December, Wallstreet turns into Pamplona.
 

Attachments

  • ym.jpg
    ym.jpg
    63.3 KB · Views: 242
  • nazcrack.jpg
    nazcrack.jpg
    53.3 KB · Views: 219
Last edited:
Top