Nasdaq Comp Gaps and Reversals Thread

So much for thoughts of a pullback on Friday……!?

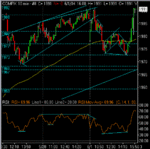
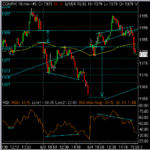
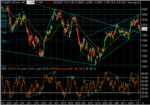
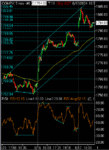
6 consecutive green days for the Naz, but the low volume rising wedge chart pattern on ND RSI signals that things are weakening, so clearly some downside potential for today…

Some interesting details of reversals and alerts from Trade_Ideas..
 

Attachments

  • 01-06-04.gif
    01-06-04.gif
    13.6 KB · Views: 297
The Patterns are full

tradesmart said:
So much for thoughts of a pullback on Friday……!?

6 consecutive green days for the Naz, but the low volume rising wedge chart pattern on ND RSI signals that things are weakening, so clearly some downside potential for today…

Some interesting details of reversals and alerts from Trade_Ideas..
Here is a scan of stocks currently in the 'False Gap Retracement' pattern - available anytime:
http://www.trade-ideas.com/SingleAlertType/FGUR/False_gap_up_retracement.html

http://www.trade-ideas.com/SingleAlertType/FGDR/False_gap_down_retracement.html
 
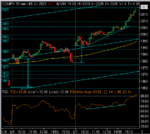
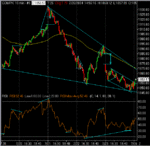
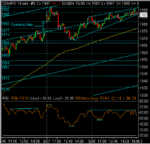
Well, the rising wedge triangle mentioned yesterday did signal downside with an ND RSI top at 1991 ish resistance showing the way down, but only as far as a clear intraday ‘W’ bottom at 1973 with PD RSI confirming support; sparking a late rally right back to resistance and a 7th consecutive win for the Naz……!

Looks ready for a pullback to me with ND quite pronounced on the 10min chart, but if resistance at around 1991 gets taken out, a test of channel resistance at 2010 ish could be on the cards shortly imho…......
 

Attachments

  • 02-06-04.gif
    02-06-04.gif
    13.9 KB · Views: 286
  • 02-06-04a.gif
    02-06-04a.gif
    24.6 KB · Views: 288
The first ‘red’ day in 8 for the Naz, but only just, closing a mere –1.79 points down….

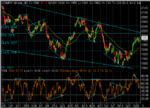
Return trip intraday action, opening with minor gap up to a ND top on RSI signalling a pullback off resistance at 1997, falling to find support at 1978 ish confirmed by a short duration double-bottom on the price and RSI just below the 100ema, causing a reversal and a surge to prior resistance…..(slightly aided by a falling oil price…… ;) )

Could be a volatile, news dominated, couple of sessions ahead with OPEC today, and NF payrolls tomorrow ……….
 

Attachments

  • 03-06-04.gif
    03-06-04.gif
    13.8 KB · Views: 244
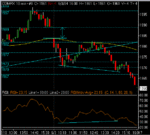
A gap down at the open falling through the 100ema set a very negative tone for the day and the Naz never looked back…..

No gap fill, the one surge north merely bouncing off the 100ema, and an attempt to find support at 1967 ish with a hint of PD on RSI, failing miserably to end the day at the low………

Almost predictably, no buyers about ahead of the infamous NF Payrolls data today at 13.30 BST, and sellers ruling the roost…..

Bound to be a highly volatile, data driven session ahead, with the possibility of gap fill (or not… :confused: )
 

Attachments

  • 04-06-04.gif
    04-06-04.gif
    11.7 KB · Views: 275
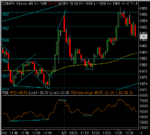
A big ‘pop’ opening on Friday creating a huge 20+ point gap, but filling Thursdays gap down……a rise to the 1995-98 much tested resistance zone, and ND on RSI signalling downside and a return trip to the close….

Futs today assuring another ‘pop’ opening, but the lower gap unfilled from Friday could well act like a magnet…......
 

Attachments

  • 07-06-04.gif
    07-06-04.gif
    13.8 KB · Views: 260
Well, we got yet another ‘pop’ opening followed by a bullish performance with no hint of any magnetic pull from the two gaps below, but the Naz will almost undoubtedly retrace to address these soon……

Top line channel line resistance has been reached at prior S/R level 2020 ish (60min chart) so maybe we can anticipate some consolidation/pullback before new direction is assumed….

I’ll quit daily postings on the thread now that maybe a short term ‘top’ has been reached (?) and full confirmation of the power of the ‘island reversal’ setup that kicked off the topic in mid-May; it wasn’t intended as a long term study - in future I’ll just post any ‘major’ setups that I notice.

If you are trading the Dow/S&P, it’s well worth keeping an eye on the Naz, as it often shows clear reversal signs first ie:- the Naz had decisively reversed off its 2150ish high at the end of January 04 and it was mid February before the Dow/S&P followed suit – the Naz had headed north from its island reversal on 18th May; the Dow/S&P didn’t move until 25th May….
 

Attachments

  • 08-06-04.gif
    08-06-04.gif
    13 KB · Views: 278
  • 08-06-04a.gif
    08-06-04a.gif
    28.8 KB · Views: 260
Since the last post over 2 weeks ago, the Naz has retained it’s bullish profile, with a minimal 38.2% fib pullback signalled by the ND RSI at the 2020 ish high, and forming a bull flag just under the resistance of the top trendline.

As of yesterday, we have a breakout north which is now approaching prior resistance in the 2032 area….

Very pronounce ND RSI on the 10min chart leaves little doubt that a pullback from resistance is likely soon……..
 

Attachments

  • 24-06-04.gif
    24-06-04.gif
    22.8 KB · Views: 278
A nice gap up at the open today, and the almost inevitable ‘gap fill’ happening before our eyes now…….

Pulling the Dow and S&P down with it…….

ND on RSI confirming the outcome....
 

Attachments

  • 28-06-04.gif
    28-06-04.gif
    11 KB · Views: 252
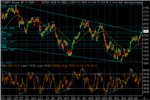
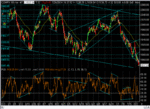
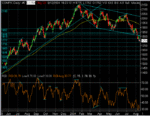
The Naz has now confirmed a well defined reducing uptrend channel since the May low at 1860 ish and the island reversal sighting which kicked off the thread…..

RSI divergence, both positive and negative have given a reliable indication of the short term index direction…

Will be watching for a break of the channel boundary trendlines to give an indication of future direction, but not automatically assuming a bearish outcome despite yesterday’s sharp decline…….

(But the bears must be feeling hopeful as the index tests the lower line…… :confused: ......)
 

Attachments

  • 02-07-04.gif
    02-07-04.gif
    29 KB · Views: 299
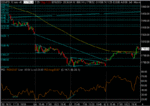
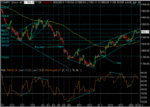
Well, as mentioned above, the hopes of the bears have been realised and the Naz is testing support at 1850 ish yet again – showing signs of yet another short term bottom at this level with PD developing on RSI, but with the index struggling to hold onto the 100ema in this timeframe, we might be forgiven for suspecting that it is only a matter of time before current support levels give way with serious downside resulting……….
 

Attachments

  • 22-07-04.gif
    22-07-04.gif
    23 KB · Views: 308
ooo you Bear you! I see it as 5 waves failing to push down so we go up....Not that I know anything about the Naz.
 
CM - I'm trying to coax Naz into telling us about the Naz - then we'll know where it's really going......... :cheesy:
 
With PD on RSI, a bull flag, and a gap above to be filled; the Naz could be ready to work off short term oversold conditions with a ‘green’ day…….. :cool:
 

Attachments

  • 26-07-04.gif
    26-07-04.gif
    17.7 KB · Views: 288
‘Green’ on hold while the Naz homes in on the lower trendline in the bigger picture….
 

Attachments

  • 26-07-04a.gif
    26-07-04a.gif
    36 KB · Views: 321
Possibly a tad too early to speculate with a bullish tone, but are we witnessing another island reversal in the making……?!

All bets are off if oil hits $50/barrel………. :confused:

(but good numbers from CSCO after the bell could add to the momentum north…..!)
 

Attachments

  • 10-08-04.gif
    10-08-04.gif
    17 KB · Views: 301
Well, all ‘island reversal’ bets are off for now as the black stuff heads north of $45…….and the Naz heads south……….and a major trendline break……..very bearish…..

Less than scintillating numbers from HP/ CSCO added to the downdraught.....

Quite a few S/R bands below – take your pick…..!

1735 looks quite strong, but so does 1689 ish…!....bears rool for now (‘til the next ‘handbrake turn’……… ;) )
 

Attachments

  • 12-08-04.gif
    12-08-04.gif
    22.9 KB · Views: 262
Last edited:
As mentioned above, we've had the almost predictable "handbrake turn" and the bulls have been let out for a short gambol (gamble......?!)

Little surprise today that the indices hit their highs in early trading, and then fell back as oil opened and crept back over $46.50/b (again……..!)

The Naz hovering over a big gap that could be filled today doesn’t help too much imho….. :confused:
 

Attachments

  • 17-08-04.gif
    17-08-04.gif
    14.4 KB · Views: 259
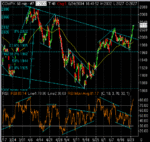
The gap mentioned above was very briefly filled, and having done so, the Naz took off bigtime! The setup on the 60min chart possibly still qualifies as an Island Reversal (similar to the one that kicked-off the thread in May..!) and has certainly produced a strong burst of upside…..

However, we have a rising wedge pattern that can signal an imminent retracement, so maybe the bears are ready on the sidelines……

I tend to watch the Naz when trading other indices as very often the intraday patterns are clearer and the Naz often leads the move…… ;)
 

Attachments

  • 26-08-04.gif
    26-08-04.gif
    23.8 KB · Views: 258
Top