Pipsaholic
Well-known member
- Messages
- 277
- Likes
- 3
Yes, I am ready to make money. I didn't say I soley used indicators I hate them but they help imo for new traders to view market structure.
Okay your looking for a gartley patterns on several currencies some appear some dont but you decide to leave the indicator in the bin you spend hours drawing fibs and possible errors by the time you see price already has moved a chunk rather than using the indicator spotting it and putting it away and doing your own price action anaylsis. Indicators do help outside trading cars, pilots, solar system has indicators.
Well, I haven't happy son? Say, something constructive for once.
What the hell on planet earth has Alexander Elder got to do with this conversation I didn't even mention him bolloks.
Where does it say in the rules that I cannot post several threads isn't that what a discussion forum is about your excellency. Fallen for every scam what are you on about.Never used a robot.
Your wrong you haven't checked why dont you?
At last a decent trader looking to help out who is not biased. I agree I need to move up timeframes to the daily. I have been successful demo trading for 90 days and has low drawdown, which lead me to a live account trading small lot sizes. The fact my system stayed the same the only thing that would be different would be it was earlier in the year on demo and live is last few months. Yes, I agree with useless info out there, but I feel you need to filter it out and use the decent info to your advantage to create your edge in trading. That's interesting about the smaller timeframes to my understanding I thought it was all the same if you kept money/risk management the same. Thanks for the info it helps.
It wasn't so long ago you were telling us Loz Lawn was a millionaire and was the real deal. What happened that route to trading riches?
I decided to go my own way with my own system.
Hi guys, I have redefined my trading strategy and my god how much you learn what your doing when you erase and add bits on top of it. Please review with constructive replies things I should take off or ignore things I have forgotton please add.
So, neil there is not 1 thing in there which is decent? If so, i guess you don't trade yourself do you?
Don't cry. Scrap the list and start again. By the time you have worked through your list it is time to go home.
Rule number one....KISS😍
Well I took a quick look at the doc...and one thing jumped out straight away...something about disregard diamonds.
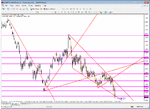
Well let me show you something about diamonds.
This was a play from today and everybody can call it what they like, but for this demonstration it is called a CV Diamond 😆
Here's how it goes.
Price makes an exhaustive top, after a decent directional move.....we take no action but we observe periodically to see what happens next.
Throughout the day, price continues to fall......we are not interested in trading any of this, we just observe.
Price breaks below the last obvious sideways consolidation area....we do nothing except observe
Price extends downwards to approx 200% of the previous exhaustion upside move......at this point we get more interested in setting up for a trade
We calculate the numbers, top to bottom is 228 points, half this number 114 sits comfortably within the previous known consolidation zone @ 12,110. So having done the numbers we can also look for reasons to get long from the exhaustion retrace swing point bottom and the two most glaringly obvious reasons are Stops and Retrace move completed on the previous directional trend move.
If those traders who short after the break of the previous consolidation decide to place stops, they are likely to place them just above the highs of the consolidation 12,114 ,we will call these weak stops.
Sooooo what happened !!
I suggest you watch your words and mention contrustrive fair comments, which the wider t2win community can benefit from. I am tired at reading complete BS from some so called legendary member comments on this forum that have nothing to do with trading in the slightest. Better not to comment at all.
Great stuff mate.
Tell me how do you measure or I should say what tool do you use to get those percentages on those moves?
Mate, put the trading books down, pick up a maths book, analyse what all these indicators that you're using actually are and how they're derived, and then consider why you should still use them. At the moment you're just looking at a graphic on a chart without any understanding of what it actually means. I'm not saying don't use them as I'm sure there are people out there using them to make money I can only dream of but the difference is that they'll know what their looking at.
Mate, put the trading books down, pick up a maths book, analyse what all these indicators that you're using actually are and how they're derived, and then consider why you should still use them. At the moment you're just looking at a graphic on a chart without any understanding of what it actually means. I'm not saying don't use them as I'm sure there are people out there using them to make money I can only dream of but the difference is that they'll know what their looking at.