You are using an out of date browser. It may not display this or other websites correctly.
You should upgrade or use an alternative browser.
You should upgrade or use an alternative browser.
Morning guys,
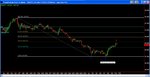
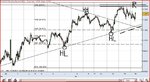
Nice trade on UJ this morning (if you were around at stupid oclock) 4Hr had been in a down trend for the last few weeks and finally made a bottom. The two blue arrows mark the low swing points, this is a great indication that we are going to see some form of rally/retracement/correction by the second blue arrow marking a failure to make a new low. Got my fibs in from the high of the move to the low and price just bouncing off the 38.2% retracement level.

Usually I wait for a minimum of a 50% retracement however on longer term and larger moves im happy to take the 38.2%.
Entry could of been on the reversal bar or on a price turn around. 👍
pozzy
Nice trade on UJ this morning (if you were around at stupid oclock) 4Hr had been in a down trend for the last few weeks and finally made a bottom. The two blue arrows mark the low swing points, this is a great indication that we are going to see some form of rally/retracement/correction by the second blue arrow marking a failure to make a new low. Got my fibs in from the high of the move to the low and price just bouncing off the 38.2% retracement level.
Usually I wait for a minimum of a 50% retracement however on longer term and larger moves im happy to take the 38.2%.
Entry could of been on the reversal bar or on a price turn around. 👍
pozzy
Attachments
Last edited:
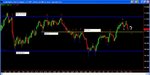
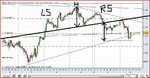
Just flicking back to the EJ chart. I have been following this 4Hr chart for a while now as it is still providing some really nice trading opportunities.
We can clearly see bounces off the extreme boundaries of the range (blue lines) But the yellow line marks a location of interest in the middle of the range that has repeatedly acted as support and resistance. Which is right where price is approaching now.
If you are trading price action then there is also a reversal 1 2 3 pattern which would give use the indication that price is going to start heading down again. So depending on how the next few bars shape up we should have a nice trade signal. Either a long on the failure to break this support level or a break of support and a valid reversal pattern on the 4HR for a short.

pozzy
We can clearly see bounces off the extreme boundaries of the range (blue lines) But the yellow line marks a location of interest in the middle of the range that has repeatedly acted as support and resistance. Which is right where price is approaching now.
If you are trading price action then there is also a reversal 1 2 3 pattern which would give use the indication that price is going to start heading down again. So depending on how the next few bars shape up we should have a nice trade signal. Either a long on the failure to break this support level or a break of support and a valid reversal pattern on the 4HR for a short.
pozzy
Attachments
I am following the same setup but now it looks like it might turn at 50% fib on the 15 min but that is just according to the way I drew fib.
what do you think?
looks ok mate but looks a little like you have taken it in the middle of the downward move if that makes sense.
Im looking at shorting again around 110.70
EJ turning around on the support level and setting up for a long.
Ill be honest and frustratingly I missed it but still can take a little (and it really is a small amount) of comfort in knowing that it would of scaled out at first target had I placed it. 😢
Ill be honest and frustratingly I missed it but still can take a little (and it really is a small amount) of comfort in knowing that it would of scaled out at first target had I placed it. 😢
Im looking at shorting again around 110.70
I took some profit from that H&S pattern. Now thinking about short either below the low or in case it hits the line (drawn below H&S) if it pulls back from it.
Attachments
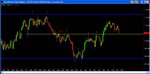
Morning guys,
Really getting a lot of life out this EJ 4HR chart. We saw a false break out short at the support level yesterday and then I missed the turn around long. We rallied all the way back up to resistance highs and now price just seems to be stalling whilst it makes up its mind.

Really getting a lot of life out this EJ 4HR chart. We saw a false break out short at the support level yesterday and then I missed the turn around long. We rallied all the way back up to resistance highs and now price just seems to be stalling whilst it makes up its mind.
pending short for me on EJ at 112.85 although things are very sideways and dosnt really look like we will see much movement but the setup is valid. I hesitated yesterday and the trade would of made some nice pips 👎 so not going to make the same mistake again.
A quick little push down and first target hit so the trade is now risk free. 👍
I know that was a very tight profit target and this can effect R:R however the market is very sideways today and so it’s important for me (as trading company money) to get the risk off the table and avoid being thrown around long then short long then short in choppy conditions.
I now have a risk free trade on so can let it run as long as it can and even compound into it should things progress nicely using the profits made as risk for a bigger position. Or just get out on an intrday portion with a few pips. Just have to see how it unfolds. 🙂
Trade on S/L at 113.05 1st target at 112.75
and there goes our EJ trade position still open and about 60 ticks in favour at the moment. Well worth the wait. 😀😀
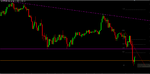
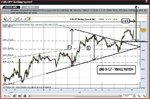
Out of boredom I've done a bit of analysis on EJ. On hourly chart there is a triangle pattern IMO.
It caused me to question my short bias for the time being.
PS If I was to trade it I would put stop below the bottom line (as per some traders understanding of the pattern). Only thing is resistance level at around 11340-11350 that may spoil it.
Risk/reward is a bit questionable if it was traded now.
Attachments
Last edited:
Similar threads
- Replies
- 4
- Views
- 3K
- Replies
- 12
- Views
- 9K
- Replies
- 6
- Views
- 5K