My FX pairs And Gold Daily Analysis

#GBPAUD: Time For Pullback 🇬🇧🇦🇺

🔻GBPAUD reached a key daily structure resistance.
The market was nicely rejected from that on 4H first,
then, a bearish engulfing candle was formed.

I expect a retracement from that structure.
Goal - 1.804
 

Attachments

  • gbpaud.jpg
    gbpaud.jpg
    97.3 KB · Views: 10
S&P500 Index (#SPY) Bearish Outlook Explained

S&P500 reached a solid horizontal key level.
The price formed a tiny double top on that and a doji candle.
Now, bears are pushing.

I expect a fall to 3886 / 3851
 

Attachments

  • 500.jpg
    500.jpg
    57.4 KB · Views: 12
#NZDJPY: Pullback From Key Level

🟢NZDJPY formed a cute double bottom pattern on a solid support on 1H time frame.
Its neckline has just been broken.

I expect a pullback to 83.24
 

Attachments

  • nzdjpy.jpg
    nzdjpy.jpg
    52.6 KB · Views: 10
#CHFJPY: Bullish Continuation Pattern

🟢CHFJPY is trading in a minor bullish trend on a daily.
The price was accumulating for 3 weeks within an ascending triangle formation.
Its resistance was broken on Friday, we see its retest now.

I expect a bullish continuation to 148.3
 

Attachments

  • chfjpy.jpg
    chfjpy.jpg
    99.5 KB · Views: 10
#EURCHF: Trend-Following Setup

🔻EURCHF is approaching a confluence zone based on a horizontal supply area
and 618 retracement of the last bearish impulse.

The price formed a head & shoulders pattern, testing that.
Its neckline was broken then.

I expect a bearish move to 0.9732
 

Attachments

  • eurchf.jpg
    eurchf.jpg
    62.6 KB · Views: 11
#EURCAD: Important Breakout! 🇪🇺🇨🇦

🟢EURCAD was consolidating for 3 months on a weekly.
The price was coiling within a horizontal range.
Its upper boundary was broken last week, and a weekly candle closed above that.

Probabilities will be high, that a new bullish wave will initiate soon.

Next resistance - 1.5
 

Attachments

  • eurcad.jpg
    eurcad.jpg
    94.9 KB · Views: 11
#USDCAD: Your Trading Plan For Today

⚠️USDCAD is consolidating on a key level.
We see a narrow horizontal range on 1H time frame.

To buy the pair with a confirmation, watch 1.369 - 1.37 horizontal resistance.
If the price breaks and closes above that on 1H, the probability will be high that we will see
a pullback from the underlined structure.

The goals will be 1.374 / 1.378
For confirmation use Moving Average Indicator

If the price sets a new lower low, the setup will become invalid.
 

Attachments

  • usdcad.jpg
    usdcad.jpg
    111.3 KB · Views: 11
CRUDE OIL (#WTI) Bearish Setup Explained🛢

On a today's live stream, we discussed 🔻WTI Oil.
The price formed a tiny double top pattern on 1H time frame,
approaching a wide supply cluster.
Its neckline was broken.

I expect a bearish continuation to 70.9 now.
 

Attachments

  • oil.jpg
    oil.jpg
    81.9 KB · Views: 10
#CADCHF: Bearish Move From Key Level

CADCHF is approaching a key daily structure resistance.
The price formed a double top pattern on an hourly time frame
and broke its neckline to the downside then.

I expect the retracement from the underlined zone.
Goals: 0.673 / 0.67
 

Attachments

  • cadchf.jpg
    cadchf.jpg
    100.7 KB · Views: 11
GOLD (#XAUUSD): Key Levels to Watch🥇

Here is my updated structure analysis for 🟢Gold.

Support 1: 1875 - 1890 area
Support 2: 1855 - 1858 area
Support 3: 1805 - 1813 area

Resistance 1: 1950 - 1960 area
Resistance 2: 1978 - 1998 area

As I predicted on a live stream, the price nicely bounced from Support 1.
I believe that the market will head towards Resistance 1.

Consider the underlined structures for pullback / breakout trading.
 

Attachments

  • gold.jpg
    gold.jpg
    100.4 KB · Views: 10
Dow Jones Index (#US30): Waiting For Breakout

⚠️Dow Jones Index is very bearish since 7th of March.
Currently, the price is stuck on a solid horizontal support, though.

For now, I am patiently waiting for its breakout.
Daily candle close below that area will confirm the violation.

A bearish wave will be expected then at least to 30900 support.

I will post an update once I spot a confirmed breakout.
 

Attachments

  • us30.jpg
    us30.jpg
    93.5 KB · Views: 9
#EURCAD: Top-Down Analysis & Trading Plan

⚠️EURCAD is approaching a peculiar horizontal demand zone.
The price formed a doji candle, testing that on a daily.

Analyzing a 4H, I spotted a double bottom with a higher low.
1.458 - 1.462 is its neckline.
If the price breaks and closes above that on 4H, I will expect a bullish movement.

Goals will be 1.469 / 1.473.

❗️If the price sets a new low though, the setup will become invalid
For extra confirmation use german sniper indicator
 

Attachments

  • eurcad.jpg
    eurcad.jpg
    61.6 KB · Views: 9
#CADJPY: Bullish Outlook Explained

🟢CADJPY formed a cute double bottom on a key horizontal support on 4H.
Its neckline was broken during the Asian session.

I believe that the pair will most likely bounce.
Target - 98.3
 

Attachments

  • cadjpy.jpg
    cadjpy.jpg
    88.9 KB · Views: 9
Bitcoin (#BTCUSD) has just broken a new yearly high!🔥

Bulls are pushing 🟢Bitcoin again.
The price have updated a new high and currently approaching 27000 level.

From a technical perspective, we see a breakout attempt of a major weekly resistance cluster.
The weekly candle closes in 2 days. Closing above the underlined area, Bitcoin will open a potential
for a further bullish continuation.
 

Attachments

  • btc.jpg
    btc.jpg
    69.7 KB · Views: 9
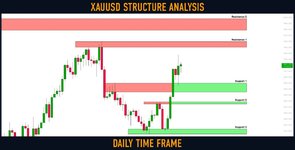
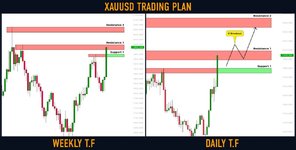
Gold (#XAUUSD): Your Trading Plan For This Week 🟡


⚠️Gold is unstoppable.

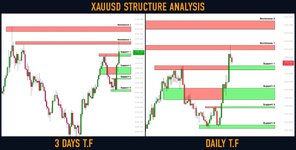
The market closed, forming a high momentum bullish candle on a daily.

The price is currently approaching a solid resistance cluster.


To catch a bullish continuation, watch 1977 - 2000 area.

If the price breaks and closes above that, probabilities will be high,

that the market will go much higher.


Next goal for buyers will be 2050.
 

Attachments

  • gold.jpg
    gold.jpg
    116 KB · Views: 7
#EURCAD: Time to Grow!
Update for my Friday's post on 🟢EURCAD.
The price has perfectly respected a horizontal key level on a daily:
after a formation of a double bottom pattern on 4H, its neckline was successfully broken.

Now, a bullish continuation is expected.
Targets: 1.469 / 1.4735
For additional confirmation use: VWAP MT4 Indicator
 

Attachments

  • eurcad.jpg
    eurcad.jpg
    66 KB · Views: 7
#NZDUSD: Classic Top-Down Setup

🔻NZDUSD is approaching a solid horizontal daily resistance.
We see a strong bearish reaction from that:
the price formed a rising wedge pattern and a head and shoulders pattern,
the support of the wedge and the neckline of h&s were successfully broken.

I believe that the pair may drop.
Goals: 0.6237 / 0.622
 

Attachments

  • nzdusd.jpg
    nzdusd.jpg
    110.3 KB · Views: 7
Dow Jones Index (#US30): Key Levels to Watch This Week

Here is my latest structure analysis and key levels to watch this week on ⚠️Dow Jones.

Support 1: 31420 - 31830 area
Support 2: 30690 - 30900 area
Support 3: 30070 - 30360 area

Resistance 1: 32250 - 32610 area
Resistance 2: 33430 - 33660 area

The market is currently stuck between Support 1 & Support 2.
The market participants are awaiting the interest rate decision on Wednesday.
It will most likely clarify the future direction of the market with a breakout.

Consider the underlined structures for pullback/breakout trading.
 

Attachments

  • us30.jpg
    us30.jpg
    117.8 KB · Views: 7
🟢GBPCHF broke and closed above a major falling trend line on a daily.
The broken trend line turned into a key vertical support now.
Probabilities will be high, that a bullish movement will initiate from that.

Next goals for buyers: 1.1423 / 1.151
For Additional confirmation use: Leading Indicators
 

Attachments

  • gbpchf.jpg
    gbpchf.jpg
    101.8 KB · Views: 7
GOLD (#XAUUSD): Detailed Structure Analysis 🥇

Here is my detailed structure analysis for ⚠️Gold.

Resistance 1: 1998.0 - 2010.0 area
Resistance 2: 2050.0 - 2070.0 area

Support 1: 1949.0 - 1960.0 area
Support 2: 1875.0 - 1904.0 area
Support 3: 1854.0 - 1859.0 area
Support 4: 1804.0 - 1813.0 area

Consider these structures for pullback / breakout trading.
 

Attachments

  • gold.jpg
    gold.jpg
    128 KB · Views: 7
Top