My FX pairs And Gold Daily Analysis

USDJPY: Key Levels to Watch This Week

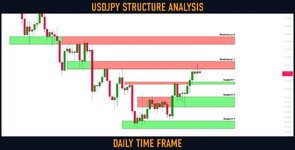
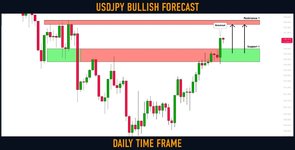
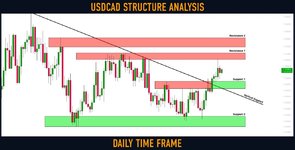
Here is my fresh structure analysis for ⚠️USDJPY.

Resistance 1: 134.48 - 135.475 area
Resistance 2: 137.6 - 138.6 area

Support 1: 132.6 - 132.9 area
Support 2: 129.7 - 131.05 area
Support 3: 127.2 - 128.2 area

Consider these structures for pullback, breakout trading.
 

Attachments

  • usdjpy.jpg
    usdjpy.jpg
    63.2 KB · Views: 8
Dollar Index (#DXY): Your Detailed Trading Plan

We have spotted earlier a confirmed structure breakout on Dollar Index.
The market is retesting that at the moment.

To catch a bullish move from that with a confirmation, watch a double-bottom pattern on the 4H time frame.

104.05 - 104.09 is its neckline.
Wait for its bullish breakout; we need a 4H candle close above that to confirm the violation.

A bullish continuation will be expected then to 104.55.

If the price sets a new lower low, the setup will become invalid.
 

Attachments

  • dxy.jpg
    dxy.jpg
    100.7 KB · Views: 13
#CADJPY: Bullish Outlook Explained

CADJPY broke and closed above a solid horizontal supply zone on a daily.
The broken structure turned into a demand zone.

Probabilities are high that a bullish wave will initiate from that.
The goal for buyers - 101.0
 

Attachments

  • cadjpy.jpg
    cadjpy.jpg
    94.9 KB · Views: 6
#NZDJPY: Pullback From Key Level

NZDJPY is taking off from key support.
The price formed a double bottom on that and broke its neckline.

Goals: 84.35 / 84.8
 

Attachments

  • nzdjpy.jpg
    nzdjpy.jpg
    93.4 KB · Views: 9
#USDCAD: Important Breakout

🟢USDCAD suddenly bounced yesterday.
The price formed a high momentum bullish candle, breaking a solid horizontal resistance and a primary falling trend line.

I believe that bulls may push the price much higher now.
Next goal - 1.366
 

Attachments

  • usdcad.jpg
    usdcad.jpg
    111.1 KB · Views: 12
DOLLAR INDEX (#DXY) Bullish Continuation

Update for my yesterday's post on 🟢Dollar Index.

The market successfully broke the neckline of a triple bottom pattern on 4H.
We see a positive bullish reaction after a retest.

A bullish continuation is expected now to 104.56 / 104.95
 

Attachments

  • dxy.jpg
    dxy.jpg
    100.6 KB · Views: 12
Last edited by a moderator:
GOLD (#XAUUSD): Update & The Thing to Watch

The market keeps coiling on a critical daily horizontal support.

Analyzing a 4H time frame, I spotted a potential inverted head & shoulders pattern.
The price has already completed the left shoulder and the head and currently, it is forming the right shoulder.

1842 - 1850 is its horizontal neckline.
The trigger to buy Gold will be its bullish breakout (4h candle close above).
A bullish continuation will be expected to 1866 / 1879 levels then.

If the price sets a new low, the pattern will become invalid though.
 

Attachments

  • gold.jpg
    gold.jpg
    101.5 KB · Views: 9
Last edited by a moderator:
#CADJPY: Pullback From Key Level

CADJPY reached a solid horizontal key level yesterday.
The price formed an inverted head & shoulders pattern on that on 1H time frame.
Its neckline was broken then.

I expect a bullish move to 100.0 / 100.25
 

Attachments

  • cadjpy.jpg
    cadjpy.jpg
    103.2 KB · Views: 10
#EURGBP: Time to Fall

EURGBP has nicely respected a wide 4H horizontal supply area.
The price formed a triple top pattern on that and broke its neckline then.

I expect a bearish move to 0.8798 / 0.8789
 

Attachments

  • eurgbp.jpg
    eurgbp.jpg
    58 KB · Views: 9
Nasdaq-100 Index (#US100) Short Trade Explained

🔻Nasdaq Index is approaching a key daily structure resistance.
The price has formed a descending triangle formation on that on 1H time frame.
Its neckline was broken, and an hourly candle closed below that, confirming a highly probable coming bearish movement.

Next support: 12000
 

Attachments

  • nasdaq.jpg
    nasdaq.jpg
    105.4 KB · Views: 8
#USDJPY: Waiting For a Breakout

⚠️USDJPY is testing a solid horizontal daily resistance.
If the price breaks and closes above 134.5 - 135.5 area,
it will push the market much higher.

The next goal for buyers will be 137.6 level.
 

Attachments

  • usdjpy.jpg
    usdjpy.jpg
    97 KB · Views: 11
Gold (#XAUUSD): The Breakout! 🟡

So it turned out that 🔻Gold dropped again.
After the release of US fundamentals on Friday,
bears started to push.

The price managed to close below a key daily horizontal structure support cluster.
It turned into resistance now.

Probabilities are high, and the market will keep falling next week.
Next support - 1787
 

Attachments

  • gold.jpg
    gold.jpg
    61.5 KB · Views: 8
Dollar Index (#DXY): Key Levels to Watch

Here is my latest structure analysis for ⚠️Dollar Index.

Resistance 1: 105.3 - 105.8 area
Resistance 2: 106.8 - 107.2 area
Resistance 3: 107.80 - 108 area

Support 1: 103.6 - 103.95 area
Support 2: 102.25 - 103.2 area

Vertical Support 1: rising trend line

Consider these structures for pullback/breakout trading.
 

Attachments

  • dxy.jpg
    dxy.jpg
    67.8 KB · Views: 12
#USDJPY: Bulls May Push Higher

Update for my Friday's post on 🟢USDJPY.
The price managed to close above a solid resistance cluster.
It turned into a support now.

The bullish rally will most likely continue.
Next resistance - 137.8

Wait for an occasional retest of a broken structure for safer entries.
 

Attachments

  • usdjpy.jpg
    usdjpy.jpg
    100.3 KB · Views: 8
Gold (#XAUUSD): Time To Sell 🟡

🔻Gold is retesting a recently broken structure.
The price has nicely respected a confluence point based on the underlined resistance and 618 retracement of the last bearish impulse.

As the extra confirmation, the price formed a double top pattern.

I expect a bearish move to 1808 / 1801
 

Attachments

  • gold.jpg
    gold.jpg
    96.3 KB · Views: 9
#USDCAD: Key Levels to Watch This Week

Here is my latest structure analysis for ⚠️USDCAD.

Resistance 1: 1.366 - 1.3707 area
Resistance 2: 1.3745 - 1.381 area

Support 1: 1.347 - 1.352 area
Support 2: 1.3225 - 1.329 area

Vertical Support 1: major falling trend line .

Consider these structures for pullback or breakout trading strategy.
 

Attachments

  • usdcad.jpg
    usdcad.jpg
    124.8 KB · Views: 7
#EURCAD: Detailed Technical Outlook

Here is the wave analysis for ⚠️EURCAD.

The market is currently consolidating with a horizontal trading range on a weekly, after a strong bullish impulse.
1.46 - 1.465 is the resistance of the range,
1.423 - 1.43 is its support.

The upper boundary of the range matches perfectly with a key weekly resistance.

Depending on the reaction of the price to the boundaries of the range, I see 2 potential scenarios:
If the price breaks and closes above the resistance of the range, one more bullish wave will be expected.
While, a bearish breakout of the support of the range will most likely initiate a correctional movement.

Wait for a breakout and then follow the market.
 

Attachments

  • eurcad.jpg
    eurcad.jpg
    107.5 KB · Views: 10
#GBPJPY: Classic Trend Following

🟢GBPJPY remains very bullish from the beginning of the year.
After the last impulsive movement, the market retraced to a peculiar confluence zone.
I see a perfect match between 0.5 retracement of the last bullish leg and a horizontal structure support.

I will expect a pullback from that to 165.0 / 165.7
vwap mt4 indicator
 

Attachments

  • gbpjpy.jpg
    gbpjpy.jpg
    93 KB · Views: 9
Dow Jones Index (#US30): Oversold Market & Pullback

🟢Dow Jones Index reached a key level.
Testing that, the price formed an inverted head & shoulders pattern on an hourly time frame
and broke a resistance line of a falling wedge pattern then.

I expect a pullback now.
Goals: 32950 / 33110
 

Attachments

  • us30.jpg
    us30.jpg
    113.8 KB · Views: 9
Crude Oil (#WTI): Bearish Outlook Explained 🛢

🔻Crude Oil is coiling on a key horizontal resistance.
The price formed a double top pattern, testing that
and broke its neckline then.

We may see a retracement from the underlined blue zone.
Goals: 76.9 / 76.36
 

Attachments

  • oil.jpg
    oil.jpg
    92.7 KB · Views: 9
Top