You are using an out of date browser. It may not display this or other websites correctly.
You should upgrade or use an alternative browser.
You should upgrade or use an alternative browser.
Coming Week
Hello Everyone, its a fine Sunday, 28 of March afternoon CET, and lets take a look at where market is standing right now after its close last week and before its opening for the next one.
EURUSD[b/]
Lets take a look at the updated daily chart that I posted couple days ago.
As we see, the trend line which is supporting the price is still not broken, and I am afraid that if we don't break it soon and the break of the triangle will not do its part, it may be the end of USD rebound. Having said that, there are many indications price will continue moving down. Maybe not in a very strong pace, but still. The fact that we have the supp line which is pointing down is one of them.
Attachments
The Triangle and 240 min support line
Another indication is that we indeed broke the triangle. And even though its not that good of a triangle, it is still a good sign. I am saying that about the triangle, because if we zoom into the 4 hour chart, we see that triangle was formed, made a false break up, came back, forming another "triangle" (or continuing the previous one) with followed break down. In terms of triangle being in cards is - its not 100% correct, because triangle was broken for the first time, but the fact that it was broken up and it was unable to move up with followed selloff is a good sign for the bears. So in the end it is even strengthening bears stand.
Still, the market was in physiological stage which on charts is described as triangle (more or less), and we should expect at least similar behavior after its break down.
But even if we leave the triangle aside for a moment, we still broke (downside) the line which was a support line. This is an important moment. We were in that formation from the beginning of this month, and now finally getting out of it (hopefully its final), we close the week below the trend line and the consolidation range.
And so, this is a good indication that market may move lower. The only thing we need to do in order to accelerate the move towards 1.1960/70 and 1.1850 is the break of the line on daily chart.
Now lets take a look at the fibo levels in order to show why 1.1960/70 and 1.1850.
Attachments
Fibonacci
There are 2 fibo levels that we may look at for the last half a year - 8 months. Both have same top at 1.29 high, but first is starting in August (gray lines) and the shorter is from November (blue - line). If we look at the blue levels, we see that the 50% was already broken at around 1.2170 and that is exactly where our trend line on previous 240 min chart started forming. If we take a look at that blue line on the previous chart, we have 3 (three) attempts to go below 1.2170/80, all of which failed and as a result we stayed in the range and formed the consolidation formation. And so, once again we see the importance of the break which we witnessed last week. Taken the fact that the market so strongly supported the 50% fibo, we may expect even stronger support coming from the next, more important 61% fibo which is at 1.1960/70 as you may see on the chart below.
But on the other hand, we have the 38% retracement of fibo which is starting in August (the gray lines) standing right at 1.21 level and still protecting it. We tested the level in the beginning of the month when we saw the strong buying coming from and the market and we also retested that level 2 last days in raw (if we look at the 240 min chart, we see that there were actually 4 tests in these 2 days). Each time the market bounced off the area.
Anyway, to sum up, there are indication of further move down, but for that to happen, we urgently need to break the 1.2050-1.2100 area. Afterwards its the 1.1960/70 that may provide the support, and next level I see as a target for my current open position is 1.1870. The market closed around 1.2130 and that's 30 pips below my entry on Friday. Stop loss is at entry level, so it can only close for zero result now. I don't know whether I will be reentering in case I get stopped for zero again, but I will try to post in that case.
That is it for now. Keep having a great weekend!
Best Wishes,
Rezo Shmertz
Attachments
darktone said:hello rezo.
do u think E/$ is done on a weekly basis?
Hi DT,
What do you mean by that? sorry, I dont fully understand the meaning... I will still try ro reply: Of course weekly is stronger than daily _> 8 hour -> 4 hour... and so on, but you showed nice channels, and indeed that may be the case. We will see...
Good Trading week Everyone!
Rezo
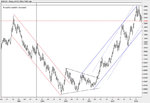
Focus: USDCAD moving down
While Euro and other majors (except for JPY) are in mixed picture, Canadian is showing a very nice picture of strengthening and the move is confident enough to start seeking for an entry. I don't remember exactly if it was a week or 2 ago when we discussed this, but USDCAD was at the time retesting the 1.34 key resistance, and it was an interesting situation whether it would finally brake or not. I said that it may be the last chance to go higher, and by a chance that is indeed what happened. It failed to break and nice confident selloff followed. Now, when we broke all the support lines, I am considering to sell USDCAD for a retest of the 1.27 low and possibly even lower.
Immediate support is coming from 1.31 level (we are trading at the moment at 1.3090/95). this level as we see is not a problem and even if it does provide some support, I am going to use the opportunity to short on a bounce. Most probably it will be tomorrow, so I will try to post a live call on it.
This 1.31 level should not be a problem at all because of the fact that we definitely failed to go higher and now, after the 4th attempt in last 3 months to break above 1.34 levels failed and we broke the small channel on daily chart, move may accelerate even more.
Good Luck Everyone,
Rezo