1Week1Trade
Newbie
- Messages
- 8
- Likes
- 0
Here is my new article on my blog ( jsut check my username). Hope you enjoy it !
Summary
Hello readers! Today’s article will be quite special. I want to aware you about one of the best Investing opportunity I can think of nowadays: going long volatility, horizon 1-3 months, goal: +100% at least.
I have been working on this article for quite a time now and I hope you enjoy it!
I will first introduce the VIX index
Then I will explain why it is a good time to go long volatility. For that I will adopt a “bottom-up” approach, looking first for the fundamental reasons, before moving to the technical ones and finally explaining why I think the Fed tightening could act as a catalyst and trigger a large surge in volatility
In a last part, for once I will discuss about the different concrete ways to invest in this kind of asset, as it is not easy to do so for a retail investor.
I just want you to keep in mind that this is not an article which recommends to go long now volatility. I just want to open your mind about this kind of investment and its benefit, and to show you why we are in period where a nice window of opportunity could occur soon.
Basics
The VIX is a mathematical measure of how the market thing the S&P 100 Index option will fluctuate over the next 12 months. The VIX rises when put option buying increase, it is a contrarian indicator.
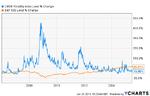
Negative correlation with the S&P 500

I choose to make this chart with a data format using the % of change to cast the light on the strong negative correlation between the S&P 500 and the VIX. You can see on the chart above why the VIX is called the “fear index”. If you look the 2008-2009 period, you can see that the VIX is inversely replicating, with a much higher amplitude, the S&P 500 movements.
Historically low levels
Currently the VIX is at around 12-14 and has been moving between 12 and 25 for the past year. My view is at least a quick double in value in the next 3-6 months. I consider that a 100% performance or more is not a dream.
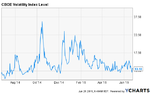
1Y VIX chart:

If you look at the chart above, you can notice that such variation are not uncommon. In some case, such as in 2008, is even peaked at 65 before going back to “normal” levels.
My idea is that we are near historical low. A VIX around 12 is not common at all and this level act as a resistance.
In this part I wanted to cast the light on the huge potential gains if the investor adopt a correct timing.
After the 6 years bull market the US equities have been experiencing, I for one think that we are on the verge of experiencing a new, and totally different momentum, characterized by much more volatility. This is a kind of bearish warning as I would not be surprise if a major correction were to occur.
The fundamentals of my scenario are in place (will be edited soon)
The Fed is gonna hike soon (see after detailed analysis)
The debt level are again extremely high.
Some industry are suffering: the oil Industry
The huge rally in the dollar is weakening some US companies. US exporters are under a lot of pressure. Just as a remember, since August 2014 alone, the US dollar has appreciated by around 15% against a basket of currencies, and particularly has appreciated 20% against the Euro and the Japanese yen. We reached 2003-low level this week for the euro and the ongoing QE will not help with this trend. The dollar strength may serve as a headwind for the U.S economy.
Next Earning period could be a catalyst
US economy is OK but the world is slowing down
The Technicals
The specific current market environment is setting a troublesome framework.
With the strong injection of liquidity and the seek for return resulting from global monetary easing, the equity market has been under steroids. We are entering the sixth year of the US bull market and this anniversary is an opportunity to have a look at some key issues.
Ultra loose policy has helped the S&P 500 and the Dow Jones to post record closing highs, and the Nasdaq to cross the 5000 (see here my analysis of a short opportunity on the Nasdaq) . It is a fair view to say that the equity market is not likely to keep this path. Without speaking of bubble, one can say that stocks begin to be overvalued. The Shiller P/E for the S&P 500 – a cyclically adjusted measure- is currently 27.12, versus a long-term median of about 16. Ominously, that’s right about where it was before the financial crisis in 2008.
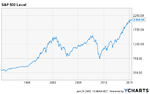
I choose to present to you the simple chart below for one reason, to show you how well the S&P has been doing over the recent year. I know it is kind of stupid to just drop a graph of the S&P level over the past decades here, but it can be interesting, from time to time, to put things into perspective.

My point here is: “It looks like we have experienced a hell of a rally recently.” I want to emphasize that the long-life of the current bull market is beginning to be problematic. The more the bull stay, the more potential for downsize there is. It has been more than four years (since October 2011) that the S&P500 hasn’t suffered a decline of 10% or more, or as it is called, a correction. I know some bull will not appreciate my remark, but we are not living in Poneyland, and the market “logic”would be that some kind of correction is coming.
The Federal Reserve rates hike will lead to a strong volatility surge in equity prices.
My point in this part is that the market is over-reacting about the future Fed tightening and that it could lead to a lot of volatility among all asset classes, and particularly equities.
The Fed has made it clear that they may speed up its timetable for raising rates. The market is betting on a rise around September and the last statements of the Fed go in that way. Yet the timing is not the most relevant issue at stake here. Indeed, whether it happens in June, September or at the end of the year, I think that there is a strong possibility of an overreaction of the market in all cases:
-First, let’s remember that it has not been done for one decade. Market players are now used to the low-rate environment. Indeed, it will be the federal reserves first rate hike since 2007. The 6-year bull market has been made possible by the Fed’s policy of near zero rates since 2008. It is a simple phenomenon: investors were pushed into riskier and riskier assets by making the alternatives look less attractive.
-In addition, historical reaction of the market when rates are rising. Since World War II there have been 16 cycles of rising interest rate and 13 times the stock market suffered (6-months before/after the first hike, the S&P 500 experienced a decline of 5%; according to Sam Stovall, chief equity strategist at S&P Capital IQ).
The psychology of the market is set in a bearish view of the hike.
We can see that investors are fearing a negative reaction of the market. The stronger than expected US jobs report on Friday led to a strong drop in US stocks. It forced the market to look ahead. Investors are beginning to be nervous and to overreact to some mere data/news release. This emotional bias may be the key driver of the incoming volatility.
Investing in volatility is not that easy. The easiest way to do so is to buy a leveraged exchange traded product that is to track the daily percentage moves of the VIX index. You can go for exchange-traded funds (ETFs) or exchange-traded notes (ETNs). The largest and most successful VIX product is the iPath S&P500 VIX Short-Term Futures ETN (VXX)
I will make it clear right now, the effective annual return of this product is around -68% since its inception. It is a result of the VIX term structure always being in a state of contango since 2009. Let’s not forget that I am proposing this long idea with a short-term horizon in mind. Indeed the issue with such an investment is the timing of the entry. Volatility ETFs loose a lot of value on the long-term due to the contango-associated rollover losses made by trading VIX futures. Those ETFs underperfom dramatically the VIX futures market. You don’t want to play it as a long-term investment, this is a speculative investment with at best a mid-term approach.
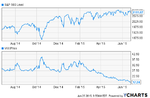
The graph below shows the inverse correlation between the VXX and the S&P 500 over the last 6 months.

As you can see with this chart, the VIX is a great way to play a drop in the S&P 500. Returns (as losses) can be huge.
As you can see, in October 2014 for instance, a drop of 5% in the S&P500 results to a 45% rise in for the VXX. My point here is to show that the VXX is a relevant way to hedge a portfolio against market volatility. With the previous reasons I have developed, I think an investor will certainly face negative volatility in his equity investments. Allocating 5 or 10% of the portfolio to product linked to the VIX is a nice strategy to go through the beginning of the Fed tightening cycle.
Whether you want to speculate or whether you want to hedge other positions. I target a 100% return over the next 6 months. I don’t know exactly when but as I tried to show you before, a huge surge in volatility will happen. Once a nice profit is made, you should think about quickly leaving your positions. You can see in the first graph that all spectacular rises are followed but spectacular drops. What I recommend is to sell a little by a little to secure the profits before going full cash as the trend is reversing (and then play the opportunity at buying at a bottom the asset which would have suffer the most from the surge in volatility, but this is another thing for another article).
Summary
What is the VIX?
New period for the US equity market which should be characterized by huge volatility surges. I think that the VIX could at least double.
High stock valuations and so-so fundamentals are setting the framework.
The Fed hike will be a catalyst and a nice correction is probable…
Investing in the VIX whether for speculation or for hedge is thus a relevant idea. How to do so?
Hello readers! Today’s article will be quite special. I want to aware you about one of the best Investing opportunity I can think of nowadays: going long volatility, horizon 1-3 months, goal: +100% at least.
I have been working on this article for quite a time now and I hope you enjoy it!
I will first introduce the VIX index
Then I will explain why it is a good time to go long volatility. For that I will adopt a “bottom-up” approach, looking first for the fundamental reasons, before moving to the technical ones and finally explaining why I think the Fed tightening could act as a catalyst and trigger a large surge in volatility
In a last part, for once I will discuss about the different concrete ways to invest in this kind of asset, as it is not easy to do so for a retail investor.
I just want you to keep in mind that this is not an article which recommends to go long now volatility. I just want to open your mind about this kind of investment and its benefit, and to show you why we are in period where a nice window of opportunity could occur soon.
Let’s have a look at the VIX, the so-called “fear index”.
Basics
The VIX is a mathematical measure of how the market thing the S&P 100 Index option will fluctuate over the next 12 months. The VIX rises when put option buying increase, it is a contrarian indicator.
Negative correlation with the S&P 500
I choose to make this chart with a data format using the % of change to cast the light on the strong negative correlation between the S&P 500 and the VIX. You can see on the chart above why the VIX is called the “fear index”. If you look the 2008-2009 period, you can see that the VIX is inversely replicating, with a much higher amplitude, the S&P 500 movements.
Historically low levels
Currently the VIX is at around 12-14 and has been moving between 12 and 25 for the past year. My view is at least a quick double in value in the next 3-6 months. I consider that a 100% performance or more is not a dream.
1Y VIX chart:
If you look at the chart above, you can notice that such variation are not uncommon. In some case, such as in 2008, is even peaked at 65 before going back to “normal” levels.
My idea is that we are near historical low. A VIX around 12 is not common at all and this level act as a resistance.
In this part I wanted to cast the light on the huge potential gains if the investor adopt a correct timing.
So let’s enter the core of my article: why I think the VIX could double soon?
After the 6 years bull market the US equities have been experiencing, I for one think that we are on the verge of experiencing a new, and totally different momentum, characterized by much more volatility. This is a kind of bearish warning as I would not be surprise if a major correction were to occur.
The fundamentals of my scenario are in place (will be edited soon)
The Fed is gonna hike soon (see after detailed analysis)
The debt level are again extremely high.
Some industry are suffering: the oil Industry
The huge rally in the dollar is weakening some US companies. US exporters are under a lot of pressure. Just as a remember, since August 2014 alone, the US dollar has appreciated by around 15% against a basket of currencies, and particularly has appreciated 20% against the Euro and the Japanese yen. We reached 2003-low level this week for the euro and the ongoing QE will not help with this trend. The dollar strength may serve as a headwind for the U.S economy.
Next Earning period could be a catalyst
US economy is OK but the world is slowing down
The Technicals
The specific current market environment is setting a troublesome framework.
With the strong injection of liquidity and the seek for return resulting from global monetary easing, the equity market has been under steroids. We are entering the sixth year of the US bull market and this anniversary is an opportunity to have a look at some key issues.
Ultra loose policy has helped the S&P 500 and the Dow Jones to post record closing highs, and the Nasdaq to cross the 5000 (see here my analysis of a short opportunity on the Nasdaq) . It is a fair view to say that the equity market is not likely to keep this path. Without speaking of bubble, one can say that stocks begin to be overvalued. The Shiller P/E for the S&P 500 – a cyclically adjusted measure- is currently 27.12, versus a long-term median of about 16. Ominously, that’s right about where it was before the financial crisis in 2008.
I choose to present to you the simple chart below for one reason, to show you how well the S&P has been doing over the recent year. I know it is kind of stupid to just drop a graph of the S&P level over the past decades here, but it can be interesting, from time to time, to put things into perspective.
My point here is: “It looks like we have experienced a hell of a rally recently.” I want to emphasize that the long-life of the current bull market is beginning to be problematic. The more the bull stay, the more potential for downsize there is. It has been more than four years (since October 2011) that the S&P500 hasn’t suffered a decline of 10% or more, or as it is called, a correction. I know some bull will not appreciate my remark, but we are not living in Poneyland, and the market “logic”would be that some kind of correction is coming.
The Federal Reserve rates hike will lead to a strong volatility surge in equity prices.
My point in this part is that the market is over-reacting about the future Fed tightening and that it could lead to a lot of volatility among all asset classes, and particularly equities.
The Fed has made it clear that they may speed up its timetable for raising rates. The market is betting on a rise around September and the last statements of the Fed go in that way. Yet the timing is not the most relevant issue at stake here. Indeed, whether it happens in June, September or at the end of the year, I think that there is a strong possibility of an overreaction of the market in all cases:
-First, let’s remember that it has not been done for one decade. Market players are now used to the low-rate environment. Indeed, it will be the federal reserves first rate hike since 2007. The 6-year bull market has been made possible by the Fed’s policy of near zero rates since 2008. It is a simple phenomenon: investors were pushed into riskier and riskier assets by making the alternatives look less attractive.
-In addition, historical reaction of the market when rates are rising. Since World War II there have been 16 cycles of rising interest rate and 13 times the stock market suffered (6-months before/after the first hike, the S&P 500 experienced a decline of 5%; according to Sam Stovall, chief equity strategist at S&P Capital IQ).
The psychology of the market is set in a bearish view of the hike.
We can see that investors are fearing a negative reaction of the market. The stronger than expected US jobs report on Friday led to a strong drop in US stocks. It forced the market to look ahead. Investors are beginning to be nervous and to overreact to some mere data/news release. This emotional bias may be the key driver of the incoming volatility.
I recommend Being Long volatility for speculation or hedging
Investing in volatility is not that easy. The easiest way to do so is to buy a leveraged exchange traded product that is to track the daily percentage moves of the VIX index. You can go for exchange-traded funds (ETFs) or exchange-traded notes (ETNs). The largest and most successful VIX product is the iPath S&P500 VIX Short-Term Futures ETN (VXX)
I will make it clear right now, the effective annual return of this product is around -68% since its inception. It is a result of the VIX term structure always being in a state of contango since 2009. Let’s not forget that I am proposing this long idea with a short-term horizon in mind. Indeed the issue with such an investment is the timing of the entry. Volatility ETFs loose a lot of value on the long-term due to the contango-associated rollover losses made by trading VIX futures. Those ETFs underperfom dramatically the VIX futures market. You don’t want to play it as a long-term investment, this is a speculative investment with at best a mid-term approach.
The graph below shows the inverse correlation between the VXX and the S&P 500 over the last 6 months.
As you can see with this chart, the VIX is a great way to play a drop in the S&P 500. Returns (as losses) can be huge.
As you can see, in October 2014 for instance, a drop of 5% in the S&P500 results to a 45% rise in for the VXX. My point here is to show that the VXX is a relevant way to hedge a portfolio against market volatility. With the previous reasons I have developed, I think an investor will certainly face negative volatility in his equity investments. Allocating 5 or 10% of the portfolio to product linked to the VIX is a nice strategy to go through the beginning of the Fed tightening cycle.
Whether you want to speculate or whether you want to hedge other positions. I target a 100% return over the next 6 months. I don’t know exactly when but as I tried to show you before, a huge surge in volatility will happen. Once a nice profit is made, you should think about quickly leaving your positions. You can see in the first graph that all spectacular rises are followed but spectacular drops. What I recommend is to sell a little by a little to secure the profits before going full cash as the trend is reversing (and then play the opportunity at buying at a bottom the asset which would have suffer the most from the surge in volatility, but this is another thing for another article).