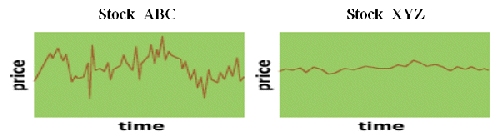
I've probably mentioned the term volatility in every article I've written about options trading. Everyone probably has an intuitive feel as to what volatility means, for example looking at the following charts of stocks ABC and XYZ, it's pretty clear which one is more volatile. If you think it's XYZ, you probably should hold off a little before you start trading options (or anything else for that matter.)
So how do we define volatility and how do we measure it? In general terms, volatility is the rate that the price of a security moves up or down. It is measured by the annual standard deviation of the daily price changes in the security. Digging down a little deeper, the standard deviation is calculated by taking the square root of the average of the squared differences between the daily percentage rates of return and the average of the daily percentage rates of return. That's a mouthful and it doesn't even tell the whole story! Instead of using percentage rates of return in the calculation, in reality, the logarithm of the percentage rates of return is used. Without turning this into a math lecture, suffice it to say that using logarithms in the calculations prevents the possibility of predicting negative security prices.
The good news is that while it's important to know what volatility represents, we'll never have to actually calculate it. Of course, if you are mathematically inclined, it wouldn't hurt to try and do the calculations at least once to be sure you really understand how they work. There are 3 kinds of volatility that we have to differentiate: historical (also referred to as statistical), implied, and future predicted. Each one is important to know and use in our trading.
Historical Volatility
As the name implies, historical volatility represents volatility that has occurred in the past. It can be measured over any period of time, but to make it comparable, it must be annualized. Standard measurement periods are 20, 50, 100 and 200 days and weekly, monthly, and quarterly are also quite common. When studying volatility, it's important to know what the time period for making the calculation is. Note, that this volatility is related to the underlying security, it's not related to the options.
Implied Volatility
If you think back to the Black Scholes formula for calculating the theoretical value of a Put or Call option, you'll remember that we need to know the value of 6 variables to plug into the formula. Well 5 of them are easy to determine: the price of the stock, the exercise price, the time left until expiration, the risk free rate of return, and the annual dividend rate. The 6th one, volatility, isn't so easy to predict. However, since we know what price the Put or Call is actually trading at, we can plug the 5 variables into the formula and determine what value of volatility will produce the option price that we already know. In other words, we work the formula backwards and determine what volatility we need to input into the formula to produce the correct option price. This is referred to as implied volatility. In essence, it is the market's prediction of what the volatility of the stock will be from today until the expiration date of the option.
This concept is very important and if you hear professional traders talking about buying and selling options, they might be talking about levels of implied volatility instead of dollar prices. For example, you may hear "I sold the June 45 Calls at a 45 implied volatility and bought the August 45 Calls at a 39 implied volatility."
Future Predicted Volatility
In a perfect world, we would be able to look at our crystal ball and know what the volatility of the stock will be from today until expiration. Given that information, we can plug all six variables into the Black Scholes formula and determine with a large degree of confidence what the value of the option should be. So if we calculate the value of a Call to be $3.00, and it's trading at $2.50, we would be comfortable buying this Call and setting up a delta neutral hedge. The idea would be to capture the difference between the theoretical and actual value of the Call. (I know we didn't discuss delta neutral yet, that's my tease.) Alternatively, if the same Call is trading at $3.50, I would most likely want to be a seller of that option.
In addition to individual stocks having volatility, indexes have volatility as well. The most well known index volatility is the VIX, which is supposed to represent the volatility of the stock market in general. It is often referred to as the fear index. When there's a lot going on in the market and stocks are moving quickly (like now) the VIX is high, when there's less economic turmoil, VIX decreases.
This concept of a market volatility was first introduced by the Chicago Board Options Exchange in 1993, although they did calculate it back to 1986 to show how it would react under different market conditions. I think they wanted to capture the experience of the 1987 crash.
The VIX was originally based on the S&P 100 index as the representative of the market. It was supposed to represent the implied volatility of a 30 day at the money option. Since it was usually not 30 days to expiration, a methodology involving interpolation between 2 months and several different strike prices was used. In 2003, several significant changes were made to the VIX. The most important of which was changing the representative market to the S&P 500 from the 100. Several other changes in methodology were also introduced, but the VIX still represents a 30 day at the money implied volatility. Since the original VIX calculation was being widely used, the CBOE has continued to publish the old style index with a new ticker symbol of VXO.
Due to the immense popularity of the VIX, the CBOE has started to provide implied volatility data on several other indexes: VXN is based on the Nasdaq 100, RVX is based on the Russell 2000, and VXD is based on the Dow Jones Industrial Average. It is anticipated that many more indexes will have their implied volatilities disseminated on a regular basis and that other measures of implied volatility (say for periods other than 30 days) will also become popular. As if this isn't enough, there are now futures on the VIX and options on the VIX futures. Who knows what products and trading vehicles will be introduced in the future.
Hopefully, you have a better idea of what volatility means and how it is calculated. In later articles, I'll cover the subject of volatility skew, and how we can use that skew to make money in our trades.
Last edited by a moderator: