Martin Kay
Well-known member
- Messages
- 429
- Likes
- 0
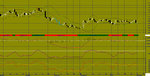
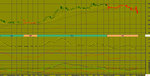
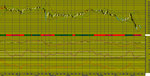
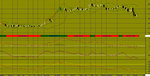
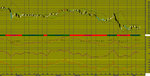
Euro Dollar / US Dollar-EURUSD As of 01/02/16
*** Intra-Daily Trading Strategy: BUY Euro Dollar / US Dollar
Buy Target: 1.0937
Enter New BUY on OPEN and exit BUY positions at Target price or at Stop price.
(NOTE: Adjust Stop Loss Price according to your trading risk.)
Do not reverse after exiting. This is a recommendation for INTRA-DAY TRADING only!!!!!
A white body has formed as prices closed higher than open.
The previous 10 candlestick bars, there are 6 white candles versus 4 black candles with a net of 2 white candles.
The previous 50 candlestick bars, there are 24 white candles versus 26 black candles with a net of 2 black candles.
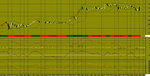
MACD is BULLISH as the MACD is above the signal line.
The MACD crossed above the signal line 2 day(s) ago. Since the MACD crossed the MACD moving average, Euro Dollar / US Dollar's price has decreased 0.37%, and has been fluctuating from a high of 1.097 to a low of 1.081.
The MACD is currently not in an Overbought/Oversold range.
There have been no divergence signals during the last 5 periods.
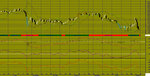
No Stochastic Buy or Sell signals generated today. The last signal was a Sell 33 Day(s) Ago.
The RSI is not currently in a topping (above 70) or bottoming (below 30) range. A buy or sell signal generated when the RSI moves out of an overbought/oversold area. The last signal was a Buy 44 day(s) ago.
Currently the RSI does not show any Failure Swings. The RSI and price of Euro Dollar / US Dollar are not diverging.
Currently, the Momentum Oscillator does not show an overbought or oversold condition.
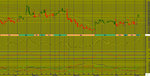
The ADX is currently below both Plus and Minus Directional indicators. This should not use to initiate any trades right now.
The Directional Movement Indicators (DMI) currently is not indicating a specific price direction. Because this is a trend following system, it should not use to initiate any trades right now. The last Directional Movement Indicators (DMI) signal was a SELL 21 day(s) ago.
There were no SAR signals generated today. The last SAR signal was a Buy 12 day(s) Ago.
The close is currently
BELOW its 200 daily moving average
ABOVE its 50 daily moving average
ABOVE its 20 daily moving average
The current market condition for Euro Dollar / US Dollar is Mildly Bearish
Euro Dollar / US Dollar closed below the upper Bollinger Band by 32.8%. Bollinger Bands are 60.67% narrower than normal. The narrow width of the Bollinger Bands suggests low volatility as compared to Euro Dollar / US Dollar's normal range. Therefore, the probability of volatility increasing with a sharp price move has increased for the near-term. The Bollinger Bands have been in this narrow range for 23 day(s). The probability of a significant price move increases the longer the Bollinger Bands remain in this narrow range.
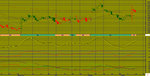
*** Intra-Daily Trading Strategy: BUY Euro Dollar / US Dollar
Buy Target: 1.0937
Enter New BUY on OPEN and exit BUY positions at Target price or at Stop price.
(NOTE: Adjust Stop Loss Price according to your trading risk.)
Do not reverse after exiting. This is a recommendation for INTRA-DAY TRADING only!!!!!
A white body has formed as prices closed higher than open.
The previous 10 candlestick bars, there are 6 white candles versus 4 black candles with a net of 2 white candles.
The previous 50 candlestick bars, there are 24 white candles versus 26 black candles with a net of 2 black candles.
MACD is BULLISH as the MACD is above the signal line.
The MACD crossed above the signal line 2 day(s) ago. Since the MACD crossed the MACD moving average, Euro Dollar / US Dollar's price has decreased 0.37%, and has been fluctuating from a high of 1.097 to a low of 1.081.
The MACD is currently not in an Overbought/Oversold range.
There have been no divergence signals during the last 5 periods.
No Stochastic Buy or Sell signals generated today. The last signal was a Sell 33 Day(s) Ago.
The RSI is not currently in a topping (above 70) or bottoming (below 30) range. A buy or sell signal generated when the RSI moves out of an overbought/oversold area. The last signal was a Buy 44 day(s) ago.
Currently the RSI does not show any Failure Swings. The RSI and price of Euro Dollar / US Dollar are not diverging.
Currently, the Momentum Oscillator does not show an overbought or oversold condition.
The ADX is currently below both Plus and Minus Directional indicators. This should not use to initiate any trades right now.
The Directional Movement Indicators (DMI) currently is not indicating a specific price direction. Because this is a trend following system, it should not use to initiate any trades right now. The last Directional Movement Indicators (DMI) signal was a SELL 21 day(s) ago.
There were no SAR signals generated today. The last SAR signal was a Buy 12 day(s) Ago.
The close is currently
BELOW its 200 daily moving average
ABOVE its 50 daily moving average
ABOVE its 20 daily moving average
The current market condition for Euro Dollar / US Dollar is Mildly Bearish
Euro Dollar / US Dollar closed below the upper Bollinger Band by 32.8%. Bollinger Bands are 60.67% narrower than normal. The narrow width of the Bollinger Bands suggests low volatility as compared to Euro Dollar / US Dollar's normal range. Therefore, the probability of volatility increasing with a sharp price move has increased for the near-term. The Bollinger Bands have been in this narrow range for 23 day(s). The probability of a significant price move increases the longer the Bollinger Bands remain in this narrow range.