Martin Kay
Well-known member
- Messages
- 429
- Likes
- 0
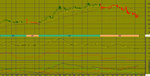
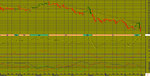
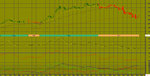
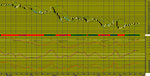
Weekly US Dollar / Japanese Yen-USDJPY As of 22/04/16
*** Intra-Weekly Trading Strategy: BUY US Dollar / Japanese Yen
Buy Target: 113.0870
Enter New BUY on OPEN and exit BUY positions at Target price or at Stop price.
(NOTE: Adjust Stop Loss Price according to your trading risk.)
Do not reverse after exiting. This is a recommendation for INTRA-DAY TRADING only!!!!!
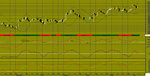
A big bullish white candle has formed. Prices closed considerably higher than open. If the candle appears when prices are "low," it may be the first sign of a bottom. If it occurs when prices are rebounding off a support area, a moving average, trend line, or retracement level, the long white candle adds credibility to the support. Likewise, if the candle appears during a breakout above a resistance area, the long white candle adds credibility to the breakout.
The previous 10 candlestick bars, there are 6 white candles versus 4 black candles with a net of 2 white candles.
The previous 50 candlestick bars, there are 25 white candles versus 25 black candles.
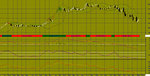
MACD is BEARISH as the MACD is below the signal line.
The MACD crossed below the signal line 19 week(s) ago. Since the MACD crossed the MACD moving average, US Dollar / Japanese Yen's price has decreased 7.62%, and has been fluctuating from a high of 123.538 to a low of 107.632.
The MACD is currently not in an Overbought/Oversold range.
There have been no divergence signals during the last 5 periods.
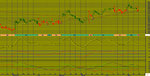
The Stochastic Oscillator is currently below 20. This is an indication of the security being in an "oversold" condition. No Stochastic Buy or Sell signals generated today. The last signal was a Buy 6 Week(s) Ago.
The RSI is not currently in a topping (above 70) or bottoming (below 30) range. A buy or sell signal generated when the RSI moves out of an overbought/oversold area. The last signal was a Buy 1 week(s) ago.
Currently the RSI does not show any Failure Swings. The RSI and price of US Dollar / Japanese Yen are not diverging.
Currently, the Momentum Oscillator does not show an overbought or oversold condition.
The last Directional Movement Indicators (DMI) signal was a SELL 34 week(s) ago.
There were no SAR signals generated today. The last SAR signal was a Sell 15 week(s) ago.
The close is currently
ABOVE its 200 weekly moving average
BELOW its 50 weekly moving average
BELOW its 20 weekly moving average
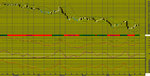
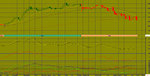
The current market condition for US Dollar / Japanese Yen is Mildly Bullish
US Dollar / Japanese Yen closed above the lower Bollinger Band by 28.3%. Bollinger Bands are 73.35% wider than normal.
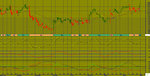
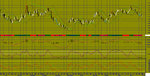
*** Intra-Weekly Trading Strategy: BUY US Dollar / Japanese Yen
Buy Target: 113.0870
Enter New BUY on OPEN and exit BUY positions at Target price or at Stop price.
(NOTE: Adjust Stop Loss Price according to your trading risk.)
Do not reverse after exiting. This is a recommendation for INTRA-DAY TRADING only!!!!!
A big bullish white candle has formed. Prices closed considerably higher than open. If the candle appears when prices are "low," it may be the first sign of a bottom. If it occurs when prices are rebounding off a support area, a moving average, trend line, or retracement level, the long white candle adds credibility to the support. Likewise, if the candle appears during a breakout above a resistance area, the long white candle adds credibility to the breakout.
The previous 10 candlestick bars, there are 6 white candles versus 4 black candles with a net of 2 white candles.
The previous 50 candlestick bars, there are 25 white candles versus 25 black candles.
MACD is BEARISH as the MACD is below the signal line.
The MACD crossed below the signal line 19 week(s) ago. Since the MACD crossed the MACD moving average, US Dollar / Japanese Yen's price has decreased 7.62%, and has been fluctuating from a high of 123.538 to a low of 107.632.
The MACD is currently not in an Overbought/Oversold range.
There have been no divergence signals during the last 5 periods.
The Stochastic Oscillator is currently below 20. This is an indication of the security being in an "oversold" condition. No Stochastic Buy or Sell signals generated today. The last signal was a Buy 6 Week(s) Ago.
The RSI is not currently in a topping (above 70) or bottoming (below 30) range. A buy or sell signal generated when the RSI moves out of an overbought/oversold area. The last signal was a Buy 1 week(s) ago.
Currently the RSI does not show any Failure Swings. The RSI and price of US Dollar / Japanese Yen are not diverging.
Currently, the Momentum Oscillator does not show an overbought or oversold condition.
The last Directional Movement Indicators (DMI) signal was a SELL 34 week(s) ago.
There were no SAR signals generated today. The last SAR signal was a Sell 15 week(s) ago.
The close is currently
ABOVE its 200 weekly moving average
BELOW its 50 weekly moving average
BELOW its 20 weekly moving average
The current market condition for US Dollar / Japanese Yen is Mildly Bullish
US Dollar / Japanese Yen closed above the lower Bollinger Band by 28.3%. Bollinger Bands are 73.35% wider than normal.