March Sugar

bgold

Established member
Messages
532
Likes
5
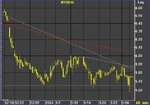
Sugar gave back gains of pastr 2 weeks within 2 days. Quite disappointing and if it wasn't for that my broker cannot take GTC stops on Sugar (still don't understand why because all other softs it is not a problem), I would have been out at 601 (the low).

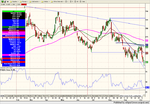
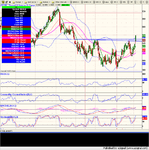
I am "puzzled", still convinced that sugar will stage a very significant rally. Various momentum indicators seem to point to bottoing out. Fe daily RSI is not (yet) confirming bottom, in fact, current price low has not RSI confirmation and did the previous.

So are we near bottom? More important what are the risks of keeping the position open?

Keen to hear your views?
 

Attachments

  • sbd08-oct-03.gif
    sbd08-oct-03.gif
    21.1 KB · Views: 589
Hi Toad,

I considered shorting today but felt I had missed the boat a little. I still think the next move will be down.

JonnyT
 
I'm not sure about this but I think Sugar has a seasonal Buy around Feb time. Maybe your historics will shed some light. I originally heard of this at Man. I think you need a password to get in. Have a butchers at mandirect.co.uk
 
My seasonal charts show the March sugar contract making a bottom end of September/ early October and then going up till about January after which it drops sharply.
 
Can you see a pattern over the years tho?
what I mean is, how often does it "work"?
 
I had a look in my Seasonal Stratagems for the seasonal sugar trades. The data look at 15 years of historical data. The table is for 2002, but of course just as valid for 2003.
 

Attachments

  • sugar_seasonal.png
    sugar_seasonal.png
    12.4 KB · Views: 594
Am I correct when assuming that avge P&L is per contract. Therefore, say, a long in Oct made on avg 212/1120 pts (eg 20cts)?

While I am still looking for confirmation of a bottom, it appears that we are getting nearer. Yesterdays' southern doji and bullish engulfing on hourly chart are encouraging. So is possibly pos divergence on daily RSI.

Where are the support levels? yesterdays' low at 591? 581? 559? lower?
 

Attachments

  • sugar.png
    sugar.png
    172.1 KB · Views: 611
BUY Sugar on 2 dec works again!

At last some bulish momentum in Sugar!

Do I spot 1. a reverse H&S, 2. yesterday a break away gap and breaching of August bearish window. Furthermore both commercials amnd large specs were short on Nov 25th.

Is a rally to at least 720 to be expected?

Shame I did not increase position on 2 dec as suggested in Andreas post.
 

Attachments

  • sugar.png
    sugar.png
    169.4 KB · Views: 545
The bullish action has been confirmed by the Mar04/Oct04 spread, which has been very well so far.

sbhsbv41205.png

Have a nice weekend,

Andreas
 
Last edited:
And then we saw the major sell-off in the past few sessions. I was referring to that in an earlier post, and that it typically occurs in January. Well it was a bit earlier this time.

Merry Christmas to all !
 
Sugar #11

Today the market confirmed for the third time that the region of 5,66 is a great suport for buyers. Although if the market losses this support, the next support is aroud 5,50. I don't beleive in that, because of the strenght that the market is showing. The market is into a down trend at the moment, and the elliot wave count is near to end. So at this point is a good and important region to look for reversion points. my guess is that the market will gain some points till the region of 6.10. but probably it will go to test the region of 5,50/5,53
 

Attachments

  • sojaweb.jpg
    sojaweb.jpg
    84.3 KB · Views: 360
one more leg down for sugar?

After hopeful hammer on Monday, sugar once again revrsed yersterday. Another false start, just proves it takes a lot of strength to turn a trend. Another low before end of month seems to be on the cards.
 
Top