Making Money Trading

Which market do you want to learn to trade?


  • Total voters
    101
  • Poll closed .
Status
Not open for further replies.
Hi Gecko,

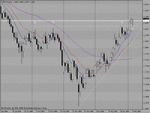
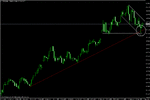
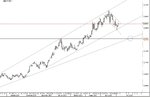
thanks alot for this precious bit of information! Risking one R and then let only a half run is one thing to think about. In my trade here I think this showed my unconfidence of the next pivot levels. Trailed stop now to 0,9472 so I at least have a 1 R on paper. What kind of R/R do you suggest to aim at while trading this pin bar setup?

argl I am doing it... asking before I finish the the whole thread :) (Page 35 :D )

Anyway thanks a lot for your help Gecko :)
 
superspurs I like the look of that eurchf, obviously I am a bit late for it now but I had a line at a similar place to you (Thick white line on chart).

What do you think of the daily chart now ? I have marked a new pivot (thin dotted line) that today has bounced off. Not a very good place for a pin though is it .........................?

Just noticed there is a pin balancing on recent highs on usdchf as well, could give more weight to the idea.
 

Attachments

  • eurchf_d1.gif
    eurchf_d1.gif
    24.5 KB · Views: 289
Last edited:
Hope some of you managed to get this.


I'm delighted to see that my chart looked exactly the same as yours and that I placed an order to trade this on Sunday night. My only problem at the moment is determining if it will go all the way to challenge last months highs. I was planning to go to B/E at 0.7892 - do you think that this is too early?

Paul
 
not a great swing into this pin bar.....but worth considering nonetheless.
 

Attachments

  • gbp-chf.gif
    gbp-chf.gif
    18.9 KB · Views: 484
Heya all :)

First of all: Thank you T_D for this thread!

I must admit that I am not through the total tutorial (only page 31) but I think I have the very basics. I won't ask silly questions till I am through :p so don't worry.

Just wanted to ask if there is a good setup at the moment on the AUDUSD: The last hour seems to be a nice pinbar. We have confluence with the 61,8% fib from the last high and the pivot level at 0,944.

audusd.PNG


Stop would be 0,9429 (red line) entry at 0,9454 (light blue line).

Now my worries: I usually look for a minimum of 2 risk / reward in each trade. The first bigger overhead resistane is at 0,9475 which is about 1 R. The next one is the longer term 0,954 (which I am not sure if this is an alltimehigh). I don't dare aiming for the 0,954 level ... so my question: would you have taken this trade?


Best regards and keep this nice work on! Moving on to page 32 :D

hi ye zishor,firstly your pin is not technicaly a pin bar,its real body is not within the previous candles real body.BUT and im far from the expert here,it is a pin and it is on the pivot price of around .9440,the fib level u mention though is the 23% level ,yes?? and i know td doesnt pay too much attention too it,probably with reason.
so i geuss this is the make your own mind up time bit!!?i personally would have traded the double bottom here with the pin as good confirmation of a long trade.only my opinion
p.s.the high on my charts is 118.96
 
Last edited:
missed this one
any opinions on this pin. bar??
did anyone trade it??
 

Attachments

  • yen111.gif
    yen111.gif
    65.5 KB · Views: 345
MP == S+R will set you free !

Last post before I quit spamming: One thing I was not that comfortable with was the exit. My plan now is to sell half of the position at my 1 R level, trail stop to entry level and let the rest do what market wants to do with it. :D
=============================================================

selling half is an accepted idea, although certainly not what i would do, but why not enjoy the security and overwhelming love and affection you can have with a closer relationship with your price moves and charts !

throughout this very good thread, you will find me "mentioning" (it often sounds like a scream, but is different actually !) about using the s+r overlays, combined naturally with the fibs ---- its how poor little newbs become rich little newbs.

enjoy and trade well

mp
 
throughout this very good thread, you will find me "mentioning" (it often sounds like a scream, but is different actually !) about using the s+r overlays, combined naturally with the fibs ---- its how poor little newbs become rich little newbs.

enjoy and trade well

wot overlays are you talkin about?the likes of metatrader charts or what??wouldnt you agree its better to figure out your own r/s??
 
MP -- support and resistance -- come and get it !

throughout this very good thread, you will find me "mentioning" (it often sounds like a scream, but is different actually !) about using the s+r overlays, combined naturally with the fibs ---- its how poor little newbs become rich little newbs.

enjoy and trade well

wot overlays are you talkin about?the likes of metatrader charts or what??wouldnt you agree its better to figure out your own r/s??
======================================================

hey jonj,

while figuring your own is certainly a very decent idea, as its all part of the learning process, theres a "cheat" available that is simpler, faster and no work at all and its because we have the computer to do the work for us !

Ive posted it before and ill attach it here with a chart that shows how it works.

use your fibs and the s+r lines and see if they match what you do by hand -- pretty simple all told !

the lines (dots really) are pretty self explanatory, the rest of it is just something from the warped mind of a right brained loner, who just does things differently !

enjoy and trade well

mp
 

Attachments

  • Support and Resistance.mq4
    1.6 KB · Views: 278
  • HI LRC.jpg
    HI LRC.jpg
    124.2 KB · Views: 407
I'm delighted to see that my chart looked exactly the same as yours and that I placed an order to trade this on Sunday night. My only problem at the moment is determining if it will go all the way to challenge last months highs. I was planning to go to B/E at 0.7892 - do you think that this is too early?

Paul

No, I think this is fine.

I would also look to add more on a sign that it is holding above 0.7892.
 
======================================================

hey jonj,

while figuring your own is certainly a very decent idea, as its all part of the learning process, theres a "cheat" available that is simpler, faster and no work at all and its because we have the computer to do the work for us !

Ive posted it before and ill attach it here with a chart that shows how it works.

use your fibs and the s+r lines and see if they match what you do by hand -- pretty simple all told !

the lines (dots really) are pretty self explanatory, the rest of it is just something from the warped mind of a right brained loner, who just does things differently !

enjoy and trade well

mp
thanx,im gonna check it out when i figure out how to get it on my charts.will be interesting to see how those and mine match up.

... the rest of it is just something from the warped mind of a right brained loner, who just does things differently !.....

your telling me!!the last chart you posted i couldnt even find the price,let alone work out where its going!!this one is nice n simple ,however,just how i like it,cheers
 
hi yawl,hope your all in the dosh tday:)
what does anyone think of this pinbar on the usd/chf.sits nicely under the 61%fib of the last daily swing high in early feb.not much else though on my charts.what i find interesting is that there are conflicting pins on different TFs
the 1 hour gives a sell pin
the 4 hour has allready given a bullish pin and has now just given a bearish pin,yet to be triggered
the daily shows a bullish star/pin
yet the weekly shows a bearish candle!!:-0
any thoughts??
 

Attachments

  • aus111.gif
    aus111.gif
    56.8 KB · Views: 344
  • aus111111.gif
    aus111111.gif
    61.9 KB · Views: 340
  • aus111111222.gif
    aus111111222.gif
    58.4 KB · Views: 321
hi yawl,hope your all in the dosh tday:)
what does anyone think of this pinbar on the usd/chf.sits nicely under the 61%fib of the last daily swing high in early feb.not much else though on my charts.what i find interesting is that there are conflicting pins on different TFs
the 1 hour gives a sell pin
the 4 hour has allready given a bullish pin and has now just given a bearish pin,yet to be triggered
the daily shows a bullish star/pin
yet the weekly shows a bearish candle!!:-0
any thoughts??

The first one that springs to mind is: STAY OUT.
 
Any thoughts on this pin bar? i'm not sure if i'm missing lines

Shane

picture.php


That is the most recent bar on the chart!
 
Any thoughts on this pin bar? i'm not sure if i'm missing lines

Shane

picture.php


That is the most recent bar on the chart!
as the next bar shows the pin never got triggered, the doller sentement is bullish.but the pin looked good to me also had things gone the other way.one line you dont have on your chart which imo is important? is the 50%fib from the december high to the recent march low,thats why i personaly liked the pin myself.
have fun
 
Good morning Sirs!

thank you Jonj for your comment :) I am not that firm with identifying pin bars right but I am learning more every day.

@mp: Is this metatrader that you use? Since I use CMC I don't think I don't have this comfort tools

Have a succesful day!
Frank
 
Good morning Sirs!

thank you Jonj for your comment :) I am not that firm with identifying pin bars right but I am learning more every day.

@mp: Is this metatrader that you use? Since I use CMC I don't think I don't have this comfort tools

Have a succesful day!
Frank

yeah,4 me its the best free option there is.have fun
 
Status
Not open for further replies.
Top