Thanks for clearing that up, I ask because well pairs and remember i do not trade them so correct me if wrong.
Trades are per 10th of a point and well daily pin bar is , well pretty large 😱 price acceptance in such a volatile market
Hey Andy,
Different SB brokers will quote the same market in a different way. The minimum move in Wheat futures is 0.25c so a move of 1 cent down should be worth 4 X your stake.
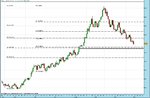
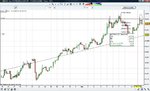
My original stop was placed 24 cents from my entry.
If I had been trading with a broker that quoted it as the standard Wheat futures contract is quoted this would have been 96 ticks (24 X 4). However, E*Trade quote in full points. So, my risk on the trade is only the original 24 ticks.
WHAT % Risk per trade :?:
what do you think is a correct %
Risk is a very difficult area to advise on. Generally 2-3% per trade is considered the recommended amount to risk.
However, it depends on the individual traders risk profile.
I will give you an example of one type of risk profile that I mentioned early in the thread and that is of a friend of mine.
This friend had heard about my trading and I suggested he open an account that offered a free bonus and I would see how much I could run it up for him. He duly agreed to do so and we decided on a "commission" that I would get on any profit I managed to make him.
When I began trading my friends account he had only the "free" £150 and there were minimum trade size requirements on the markets that I wanted to trade which meant the intial risk I was taking was huge. To give you an idea of how much risk: When I entered a position in the Dax the SPREAD ALONE was 4% of the account
🙂
He was prepared to lose the money that was courtesy of the house and which he therefore never had in the first place but was reluctant to add any of his own.
As a result, the intial trades were made with the acceptance that either the account would be blown and we would consider that the experiment to see how much we could run it up, was over OR it would grow and we would gradually reduce the risk.
So the risk profile a trader has when he trades to see
how much he can make is very different to the risk profile a trader has when he wants to
make a business of trading.
A trader that wants to make a living in this game has to watch their risk very carefully because once their capital is gone, they have no means of making it any more.
As a result of the individuality in risk profiles, I don't want to reveal how much risk I took on this particular trade in terms of percentage of account because the risk profile of the account holder I am trading is
exceptional.