lurkerlurker
Senior member
- Messages
- 2,482
- Likes
- 150
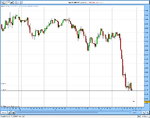
GBPJPY Update
Just thought I'd update on this failed trade. Firstly, I took this signal on an hourly pin on a day of huge movement, against the trend. This is not one of the high probability setups that TD discusses here, however I thought I'd post it as it relies on a pin bar. I took the trade fully aware that there was a very high probability of failure, and I was disciplined in accepting the risk and not moving my stop away from the market. I did get a little nervous over the trade, and I apologise if my posting became a little irrelevant.
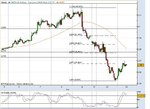
Kudos to TD, who advised that I moved my stop up from under the pin to under the hourly double bottom - this ultimately saved me 30 pips. Note that the market gapped open down 1 big figure, so I was definitely wrong on this trade. Not for the faint hearted!
As I took the trade so close to the weekend, I paid for a guaranteed stop with the SB firm I use, which would have protected me against the downside. It only cost 5 pips to do so, and given I was going long the GBPJPY over a weekend I was credited with interest which exceeded the GSO cost.
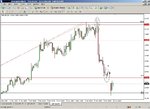
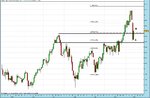
Follow up chart attached with entry and stop. Net loss 80 pips. This pair is now trading down below October suppoer, and in a congestion zone. I'll hold off on buys for the time being, but I'm not happy to sell as I see no logical place for a stop. Notwithstanding this, I've made a commitment to only take FX trades on pin bars (on timeframes of H1 and greater), so unless I see a convincing pin setup, no trade.
I'd like to point out that this pair formed valid bullish pins on 25/9 and 22/10 bouncing off the 230 yen mark, so I'll be watching for a similar signal on the dailies.
Good trading all. (and FWIW, despite my losing trade on Friday, I ended the week up, which is important to me given the losing streak I was on - the pips from the AUDCAD trade called live here by TD were also appreciated!)
Just thought I'd update on this failed trade. Firstly, I took this signal on an hourly pin on a day of huge movement, against the trend. This is not one of the high probability setups that TD discusses here, however I thought I'd post it as it relies on a pin bar. I took the trade fully aware that there was a very high probability of failure, and I was disciplined in accepting the risk and not moving my stop away from the market. I did get a little nervous over the trade, and I apologise if my posting became a little irrelevant.
Kudos to TD, who advised that I moved my stop up from under the pin to under the hourly double bottom - this ultimately saved me 30 pips. Note that the market gapped open down 1 big figure, so I was definitely wrong on this trade. Not for the faint hearted!
As I took the trade so close to the weekend, I paid for a guaranteed stop with the SB firm I use, which would have protected me against the downside. It only cost 5 pips to do so, and given I was going long the GBPJPY over a weekend I was credited with interest which exceeded the GSO cost.
Follow up chart attached with entry and stop. Net loss 80 pips. This pair is now trading down below October suppoer, and in a congestion zone. I'll hold off on buys for the time being, but I'm not happy to sell as I see no logical place for a stop. Notwithstanding this, I've made a commitment to only take FX trades on pin bars (on timeframes of H1 and greater), so unless I see a convincing pin setup, no trade.
I'd like to point out that this pair formed valid bullish pins on 25/9 and 22/10 bouncing off the 230 yen mark, so I'll be watching for a similar signal on the dailies.
Good trading all. (and FWIW, despite my losing trade on Friday, I ended the week up, which is important to me given the losing streak I was on - the pips from the AUDCAD trade called live here by TD were also appreciated!)