Making Money Trading

Which market do you want to learn to trade?


  • Total voters
    101
  • Poll closed .
Status
Not open for further replies.
Something that made a big impact on me

For every trader there are points along the journey to consistent profitability when something clicks.

You may see something, read something, overhear something else.

These points come to different traders at different times but I think we've all experienced them.

I had one when I read the following passage, early in my trading career. It had a big effect on me when I read it and I have never forgotten it. I think it has shaped me in an important way and still effects how I think about the markets.

Grab a coffee and have a read. If you've read it before, remind yourself once again what an incredible trade this was:

++++++++++++++++++++++++++

Excerpt from an interview with Randy McKay from The New Market Wizards (Jack D. Schwager).

Did you continue to meet success after your intial year? Were there any pivotal trades in those first years?

The trade that was a turning point for me was the one that took me from being a twenty-to-forty-lot trader to trading hundreds of contracts.

In 1976, the British government announced that they weren't going to allow the pound to trade above $1.72. They were concerned that the pound's strength would lead to increased imports. At the time, the pound was trading in the mid-160s. To my surprise, the market responded to the annoucement by immediately going to $1.72. The pound then fell back to $1.68 and rebounded again up to $1.72. Every time it reached $1.72, it fell back, but by smaller and smaller amounts each time. The price range steadily converged until the pound was trading narrowly just beneath the $1.72 level.

Most of the people I knew said, "They're not going to let it go above $1.72. We might as well sell it. It's a no risk trade." I saw it differently. To me, the market looked like it was locked limit-up.

I felt that if the government announced that they weren't going to let the price go above a certain level and the market didn't break, it indicated that there must be tremendous underlying demand. I thought to myself, "This could be the opportunity of a lifetime." Up to that point in time, the largest position I had ever taken was thirty or forty contracts. I went long two hundred British pound contracts.

Although intellectually I was convinced that I was right, I was scared to death because the position was so much larger than what I had been trading. In those days, there was no Reuters or similar service providing cash market quotes in the currencies. I was so nervous about my position that I woke up at five o' clock each morning and called the Bank of England to get a quote. I would mutter something about being a trader from CitiBank or Harris Trust and needing a quote quickly. I would normally talk to some clerk who thought I was a big shot, and he would normally give me the quotes.

One morning, I made the call from my kitchen, and when I asked the clerk for the quote, he answered: "The pound is at $1.7250."

I said, "What! You mean $1.7150, don't you?"

"No," he replied. "It's $1.7250."

I realised that was it. By that time, I had gotten my brother and a number of friends into the trade, and I was so excited that I called all of them with the news. I was so confident that I even bought more contracts for myself. I then just sat back and watched the market ride all the way up to the $1.90 level.

++++++++++++++++++++++++++

As I said, when I read this passage, it had a big impact on me.

But I think that what I took away from it was not the obvious message.

The obvious message from that passage is:

If the market reacts bullishly to bearish news then there is something wrong.

This is a very valid point and many, many traders use it in their trading.

But I got something very different from this passage. I felt the important message to be taken from this was:

If you get a sign that the market wants to see a level, usually it will and the single most important thing you can do is be properly positioned to take the maximum advantage of it.

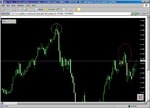
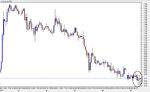
This came back to me this time last year when I was watching the pound rising to the $1.9100 area.

If you will look at the chart you will it tried this five times and everytime it did, it fell back.

Infact, on the last attempt you will see on that chart, where it had held for a little longer than usual, I went gone long and I was so sure that we were going to see $2 that I held the position even when it turned against me.

I held and held, moving my stop back each day and almost as soon as the loss got so large that I was forced out of the position because I could no longer hold it with the funds in my account, the market turned and went straight back up to $1.9150 or thereabouts.
 

Attachments

  • gbp.gif
    gbp.gif
    20.4 KB · Views: 4,493
Last edited:
When I saw the Pound hovering at that level, all I could think of was that passage from The New Market Wizards.

To me it looked like the calm before the storm. It felt to me like there was an almost unbearable tension in the market at that point.

As you can see it had been in a clear range, had moved sharply up the day before and now there it was, literally sitting on a key resistance level with nothing above (certainly in very recent history) but that $2 mark.

What I remember is that I took a large position relative to my account size and because of the fear associated with that greed, I ended up being shaken out at what I believe was breakeven.

It was a very frustrating time for me when I saw what happened next. But I wanted to share that story with you all because it is a trade I have always remembered and it shows how what we read can influence how we think and lead to good trading ideas (although in this case bad risk management)

That small bar circled measures just 39 pips from low to high. It formed on a Thursday night.

It is still the best risk to reward opportunity that I have personally seen in the seven years I have been trading.
 

Attachments

  • gbp1.gif
    gbp1.gif
    18.2 KB · Views: 5,104
Last edited:
Hi Trader Dante,

The above chart (#147) shows a very clear ascending triangle chart pattern.

Out of curiosity, do you pay attention to any chart patterns which you consider as an additional piece of important evidence ("confluence"), or do you disregard them?

Fibonelli
 
Aha Fibonelli!

Very perceptive and good question - although it raises the issue that my method is largely discretionary.

To answer your question: I will certainly draw these patterns on my charts but in almost every circumstance I want to see a price action setup before I take a trade.

There are two scenarios I look for.

Let's refer to the triangle you have noted. The best scenario is, for example, to see a breakout of this triangle and then have the breakout tested. At that point where it is tested, if there some price action such as a pin bar then you have a very, very good trade. If there is other confluence at such a level then you really have to take it.

However, in this scenario the breakout was so sharp that there was no real test.

There was no way of knowing at the time that there wouldn't be a test (apart from gut instinct) so I have to make a choice whether I will wait for a possible test or try scenario two.

In this scenario, if I feel that the pattern is so obvious that every trader in the world is likely to be watching it, then I want to get onboard before it goes. This is much riskier but it has the advantage that if it goes, you're going to get it. And if it retests you're going to likely be able to double up and make some serious money out of the move.

That bar on the GBP/USD chart is called an inside bar. It signals a consolidation and narrowing range from the previous session. I would have played a break of that upwards (directly into the resistance) with a stop just beneath the bar.

Inside bars are tricky and you can lose on them even if you are right in your market call because if the range expands to engulf the previous day you will be stopped out even if the market eventually goes the way you thought it would.

Bear in mind, also, that many traders play inside bars by putting in both a buy and sell stop and letting the market react. These traders will then have their position reversed if the range expands both sides.

So, if they have a long order and it gets filled and then the market turns and takes them out, they will now be short rather than flat. You can get badly whipsawed if you are new to this.

I know you are not Fib but it is a warning to the new traders :)
 
Last edited:
So far we have looked at one type of price action setup (pin bars) and the best places to look for them. These are at swing highs and lows. You should also look for the nose to line up with: support/resistance levels (particulary areas where the price has flipped between support/resistance) remembering that trendlines also serve as support/resistance. Then you should see if that area lines up with any key fib levels. Draw fibs from different but clear and well-defined highs/lows. Do any of them match up with key areas on top of one another?

Perhaps most importantly I have emphasised that a clever trader will prepare their charts before the trading day and wait for the market to come to them. We want to watch the market participants, see what they are seeing and take action when we get a sign that they are.

I have also told you that I use only the daily and the hourly TF but I prefer to operate on the latter.

It's been pretty simple so far but I have a huge amount to add.

I am going to set any die-hard enthusiasts with some homework :)

Take your chart and add 3 moving averages.

The 10ema
The 21ema
The 50ema

Levels you draw on your charts such as support/resistance will likely change after time as new ones occur and old ones seem to get abandoned.

The one consistent element of my charting is my moving averages.

Your homework, if you choose to do it, is when you look at your charts during the week, watch how the price reacts to the moving averages during a trend. You should notice something that almost always happens when the market is trending on ANY timeframe. More on this soon.

Thanks for reading.
 
Last edited:
Great stuff, TD.

One of the problems I had with the J16 thread was that I relied hevily on candles and most of his stuff was on bar charts. You have solved that dilemma for me.
The pin bars - are really very bullish doji like candles - dragonfly doji`s. Surrounding them, are many other bullish patterns - piercing etc. Obvously there other patterns that you will reveal (maybe) as we go along.

Your stops are the only thing concerning me. If you trade cable on the daily charts, sloss at the low of the day or 1atr will be around 150 pips. Trading 1 lot - $10/point - $1500. Given the volatility at supp/res - is it not likely that you will lose most if not all of your $1500 ? And what if this hapens on 2-3 trades, with 2-3 lots ? You can wait for the markets, but you can be sure the markets are also waiting for you.

The answer would be to have a large account. $1500 would be 1% if $1.5million - but how many of us have that ? :rolleyes:

Cheers
CT
I
 
Your stops are the only thing concerning me. If you trade cable on the daily charts, sloss at the low of the day or 1atr will be around 150 pips. Trading 1 lot - $10/point - $1500. Given the volatility at supp/res - is it not likely that you will lose most if not all of your $1500 ? And what if this hapens on 2-3 trades, with 2-3 lots ? You can wait for the markets, but you can be sure the markets are also waiting for you.

The answer would be to have a large account. $1500 would be 1% if $1.5million - but how many of us have that ? :rolleyes:

Another excellent question and partly why I make almost all of my money on hourly setups. My stops are smaller meaning I can take larger size and from my experience I have found it offers as good risk/reward opportunities as the daily TF.

I often see incredible daily setups on markets like the GBP/JPY and cannot take them because the stops are so large even for trading at £1 a point with an SB broker. This is just too bad. It's a moments pity and then time to move on.

You do have the option to trade a mini-account (or even micro) rather than full lots and clearly if you want to trade daily setups then this is the most sensible option.

I'm not sure I have correctly understood one part of your post though. The volatility at S/R has nothing to do with whether you will lose or not (if that is what you meant?). If you trade a pin or an inside bar that has its low/high on an S/R level and you take it long/short (so it is moving away from the previous S/R level) then the probability that it will continue in the direction you have taken it is is in your favour - particularly if you traded a bar with good confluence. If it comes back you are wrong and the trade is a loser...

You ask what if this happens on 2-3 trades...as you stated it could spell disaster unless your account size is huge...but just for the record I have never had two back to back losers in five months actively trading most days.
 
Last edited:
Value don"t last for long

This is an example of what I consider a high probability setup for a trade.

The bar circled is known as a pin bar. This bar indicates a potential reversal.

In addition, the nose touches both:

1. The 38 fib level of the swing low to recent high
2. A support/resistance zone. See how previous support became resistance and then turned to support again.

The fact that these two pivots line up make this a powerful confluence.

A long position would be taken when the price breaks the high of the pin bar. A corresponding stop would be placed beneath the low of the pin bar.

Trading is about having the patience to wait for these setups.

The trader that wants to win in this game has learn to wait on the sidelines until he sees an advantage. They will plot their support/resistance areas, they will draw in their trend lines and their fib levels and they will wait for the market to react to them.

Don't go to the market. Let the market come to you.

I will show you how I draw in my "pivot" areas and how I play price action bars and give you suggestions of how you can play them too but for now I'll leave you with a quote:

"Although the cheetah is the fastest animal in the world and can catch any animal on the plains, it will wait until it is absolutely sure it can catch it's prey. It may hide in the bush for a week, waiting for just the right moment. It will wait for a baby antelope, and not just any baby antelope, but preferably also one that is sick or lame. Only then, when there is no chance it can lose its prey, does it attack. That, to me, is the epitome of professional trading" - Mark Weinstein (Market Wizard)

A very informative post. One small criticism:
"Once you start looking for them you will see them everywhere".

This however will lead new aspiring traders to take setups all the time. Pinbars on a 1-minute time frame? Sure... Plenty!

It's my experience that the higher the timeframe the more reliable a pin-bar and the more powerful the signal.

But as you know where to look for pinbars, you already know which ones are the high probability ones ;)

Tom, more sound common sense !
If I see more than 3 signals per month on the same vehicle I get worried that I'm overtrading it :confused: Patience is the key. Took me years to figure out this one simple fact that can often make the difference between winning and losing.

in Elder's book, he says something like "private traders have one advantage over professionals - the ability to stay OUT of the market, yet they squander this advantage time and time again by trading when they shouldn't" (crap paraphrasing but it's too late to go digging out the actual quote)

Hi Dante,

Spent an hour reading and all excellent IMO

1st ftse trade/chart you posted, I think I posted similar or same on Ftse swing thread, the point you may want to make , its your thread, and looking very good it is to

The market or at least one market does not offer value for long and that set up, my memory may be off a bit as happened only about 3 times this year so as Rathcoole points out, patients is the key, its the ability to sit on ones hands that can make you most pennies. SEE THREAD, and have a wheeze seeing how easy it is for me:eek: and I suspect others to muck up ROYAL.

START at the point where I observed the potential set up on ftse swing thread. sorry to x thread but its on last page and a good live example I think. Page 13 last but one

This point IMO anyway is vital, beginners and some not so beginners :eek: will not improve if they cannot except this truth. Trading everything that moves kills you dead.

Looking forward to more :eek:

Andy AKA
 
Last edited:
  • Like
Reactions: BSD
I'm not sure I have correctly understood one part of your post though. The volatility at S/R has nothing to do with whether you will lose or not (if that is what you meant?). If you trade a pin or an inside bar that has its low/high on an S/R level and you take it long/short (so it is moving away from the previous S/R level) then the probability that it will continue in the direction you have taken it is is in your favour - particularly if you traded a bar with good confluence. If it comes back you are wrong and the trade is a loser...

Precisely my point - you could have an excellent set up, make 100pips in 1 day and then bang, cable reaches out a long tail and takes you out. After 3 days it goes off like a rocket, having kept that support. What am I saying is - the stop might often have to be 200+ pips and hold, not raising to BE after making 100pips the 1st day. Manging stops on daily charts on cable is really hard. You would get 2-3 trades in a year that could get 500-1000 pips...but the others would be just annoying.

I find that on 1hr, a 40-50pip stop for cable works well with a setup very similar to yours - this is usually about 1.5atr. As you say - 1hrly is much easier!!:eek:

CT
 
Precisely my point - you could have an excellent set up, make 100pips in 1 day and then bang, cable reaches out a long tail and takes you out.

Combotrader, good point raised there.

Price will often move in the direction the pin indicates and then retrace to the break of it (and your entry point)

This happens on most pairs. However, Cable is notoriously volatile. I try and stay away from this market.
 
... You should also look for the nose to line up with: support/resistance levels (particulary areas where the price has flipped between support/resistance) remembering that trendlines also serve as support/resistance.

Although I understand what you mean, there are people out there would who definitely disagree on the fact that trendlines offer "true" S/R, me being one of those. Sorry for the interruption, no further comments :) Excellent stuff that you are giving away for free here.
 
A word of warning if I may: If you take positions on EOD setups, I would advise not to monitor it in the day, if you are even remotely trigger happy in your exits.

:eek: Ok, who grassed on me??? :eek: LOL

One 'trigger happy' bunny - I now have to switch my trading programme off when I'm in a trade, just so I don't get tempted :eek: to exit once I get a couple of pips in profit.
 
pinbar

Pin bars are the price action setup I look for at my pre-drawn pivots.

The pin bar is an abbreviation of Pinocchio bar. It was coined by Martin Pring. The reason it is called Pinocchio bar is because it is based on the old European story about the wooden boy, Pinocchio whose nose grew longer the more he lied.

Pin bars lie to you about the direction the market is going in. When we see a pin bar we can take a trade in the opposite direction to one in which the nose is pointing.

Pin bars can occur at market tops. And market bottoms. Once you start looking for them you will see them everywhere. These ones I have circled stand out because our eye is naturally drawn to the highs and lows on a chart. They would have resulted in massive wins.


Hi TD

Just a query, on the chart you market pinbar, i have marked one more on red circle which looks like pinbar on first sight!, Does it qualifies a pinbar?
Thks
Fxbee
 

Attachments

  • pinbar.JPG
    pinbar.JPG
    89.6 KB · Views: 3,558
:eek: Ok, who grassed on me??? :eek: LOL

One 'trigger happy' bunny - I now have to switch my trading programme off when I'm in a trade, just so I don't get tempted :eek: to exit once I get a couple of pips in profit.

Many of us have or have had the same problem, JillyB.

I'm going to quote most of a long post I once made in my journal here at T2W (no longer active). Some of you may have read it before:

+++++++++++++++++++++++++

If you are in a situation where the position you have taken is significantly in profit, take a minute to sit quietly and think rationally. You need to focus on the fundamental thing that your position is now telling you.

You have called the market and you are RIGHT.

We know by its very nature that the market goes up and down so when we are losing we hope at some point it will come back and if we are winning we worry that it may turn and that we may give some, or worse, ALL of our profits back.

I quote from memory of another’s work (I forget the source) when I say that we are "taught" from an early age that:

a) If we lose something it will eventually come back (e.g. If you lose your car keys, not to worry, they WILL eventually turn up)

b) If you see something, take it or you might lose the chance (e.g. If you see money lying in the street, pick it up quickly because it may not be there for long)

This translates into our trading. If our position goes against us, we tell ourselves not to worry because nothing goes one way for ever and it must surely come back. If we are winning, we want to get out quickly because if we come back later, all our profit may all be gone.

The reason it is so hard to overcome this is because it has been "programmed" into us. To be a good trader, requires going against what we have had ingrained from an early age. To put it simply, it requires going against human nature - what our heads and our hearts tell us.

It's been repeated so often it’s boring. And yet all traders that don't make it in this game suffer a manifestation of the same problem. They are either not cutting losses early or not letting their profits run.

So how do you overcome this?

Pick a point before you place a trade that, if the market hits, proves you are WRONG in your analysis. If you see, for example, a pin bar at a double top, and want to go short, place your stop a little way above the double top.

I have done this before, shorted at what I consider a top, only to see the market move up through it. Rather than close, I would then move my stop further and further away with the reasoning, this climb cannot go on, its got to fall...it's just a market fake out...it will come down.

But here is the point: Who cares if it comes down an hour later? Or the next day? Your reasoning is that the double top is the turning point. If the market trades through it, you are WRONG. This is NOT the top.

What if it was only a fake out and the market then plummets? You likely end up frustrated. What if it wasn't and you keep moving your stop back? Well that's a quick way to the poorhouse. And I know which of these outcomes I think is worse.

Remember, the market has a way of frustrating every trader but the greatest traders are flexible. If you are wrong in the short term, close your position and wait on the sidelines where you can see clearly and wait for the market to move in the direction you thought it would.

Timing is everything when you are trying to make a living do this. If your timing is wrong, then get out. Sometimes the market may give you another chance but you can bet the time you need it to most, is the time you will get wiped out.

This may make you laugh but it took me, personally, just over two years to realise this simple truth: You have no control over the market. You cannot influence where it goes. The market doesn't know who you are; it doesn't care who you are, what you have or what you could lose. It goes where it goes and you either ride it or you get carried out.

So, that's how you should cut losses. How about letting profits run?

For me, a key thing to remember is NOT to look for reasons to exit a trade once it is going well.

I did this a few months back with the GBP/JPY. The trend overall was firmly up but it had suffered a rather sharp pullback over a few days. Then it had bounced at an EMA that I use and began making its way back up. So I got in based on this DAILY bar and near the end of the day it was up just over 100 points. Now I became enamoured with this 100 point gain. I had a considerable amount of money on the table and as such I started seeing reasons to exit.

Suffice to say, I found what I thought was a good one - the stochastic was overbought on the HOURLY - it was running along steadily just above the overbought line. So, out I came. Then, in the Asian session, the price steadied and while it did this the stochastic came slowly down to oversold and then began to turn up, even though the price has suffered almost no pull back.

The next morning the market was up strong again and just a few days later it was up 1,000 ticks on my original entry.

For me, the emotional pain I felt at being in it, then exiting and missing the massive move, was the same as, if not worse to just having LOST in the first place.

Remember why you entered the trade in the first place. With price action you can do this by STICKING TO YOUR TIMEFRAME. If you took a pin on the daily, do not get shaken out by a pin in the opposite direction on the hourly.

Sometimes you learn something when you least expect it. I actually had an epiphany of sorts when my girlfriend who knows absolutely nothing about the markets at all said to me: "Everyone has different reasons for doing things - they all play the game a different way."

This is the reason why the market goes up and down. Everyone is buying and selling based on different thought processes. Different strategies. Different methodologies.

But your reason is based on YOUR methodology so forget the other players. Let the market guide you.

In my opinion, a 20 tick pullback in a 100 tick move up is not a sign that the move is reversing. It is natural and it is inevitable. Consider the other market participants. In the short term they may want to scalp a small move or they may be hedging and therefore taking a position for another reason UNRELATED to profiting. These buyers and sellers will cause temporary fluctuations in price but actually exiting a good trade should be done when YOUR reason for entering is WRONG not just because it is suffering a temporary setback.

Aways try and remember – simply being UP is not a consideration for getting OUT.

Some people take signals and close on the FIRST DAY because they have made a killing. Just think for a second - You are trading off a daily bar. You've had just ONE go in your favour. Try this. Look at a massive trend that you would like to have caught. Look at a possible entry such as the double bottom, or any of the many swing highs/lows. Then count how many daily bars made up the rest of the move, from bottom to top. Now consider exiting on the first one that shows a profit.

Of course some people don't like to play this way. They like to take profits or they like to scale out as it moves their way. This is all well and good if there is a valid reason other than "this has gone really far." If you trade with the trend you can capture a very large move simply by not being so quick to exit.

I would add finally, that it is always an eye opener when you read about how other traders have managed positions. If you research some of the best and highest earning traders in the world and follow what they did on the charts you will find as I did that if you took the same position, the moment you would look to exit is usually the moment that they are looking to ADD to their position.

Look at the traders that made a killing in the incredible fall that happened in Natural Gas futures. Go and look at a chart of that market. On a daily you wonder how anyone that saw it didn't get rich. It's straight down. But then imagine being actually in it and seeing a sharp two day spike up from all the bargain hunters. Most, if not all of the people reading this, would, if honest with themselves, be long gone, patting themselves on the back for their profit even as the market turns and falls through the floor.

So to sum up: Have the strength of your convictions.

This is not to say that any trader should hold blindly. But try and be logical. Look at price action and let it tell you where the market is going over the time frame. And remember the other participants in the market.

There is always a tug of war in the market but someone is going to win...and if you are patient, that someone may be you.

+++++++++++++++++++++++++

I will show you some very good techniques for helping you hold on to your winning trades. Cutting your losers is down to you.
 
Hi TD

Just a query, on the chart you market pinbar, i have marked one more on red circle which looks like pinbar on first sight!, Does it qualifies a pinbar?
Thks
Fxbee

Hi FXbee,

No, this is NOT a pin bar. A pin bar will have the following characteristics.

- A long "nose"
- A small "body"
- The body will be in the lower/upper 1/3 of the candle or bar

Look carefully at that chart with my examples and you will see these characteristics.

You will see MANY more examples of these bars as we go on.

Tom

P.S This is to everyone not just you Fxbee: You will certainly profit from reading up on and studying pin bars. There is much more to them than I can tell you about here. At least in the meantime...

For example, some traders place relevance on the eyes (the bars immediately either side of the pin bar)

I will always try and mention everything that helps me make a trading decision but you should all be aware that some things are so deeply ingrained they are almost subconscious.

I believe this is part of the traders "instinct". It comes from experience (which translates as hours and days and weeks and years of watching the markets).

This aspect will be hard to express to you all. But I will do my absolute utmost :)
 
Last edited:
Reversals

Hi TD,

I am prone to playing the odd reversal here and there, as we speak I have taken a tweezer/pin long off the round number rejection on USD/CHF.
I absolutely abhor playing these falling knives - have you been prone to taking these and if so how do you train yourself not to?

Cheers,

SMB
 

Attachments

  • usdchf.png
    usdchf.png
    11.4 KB · Views: 3,511
Last edited:
Although I understand what you mean, there are people out there would who definitely disagree on the fact that trendlines offer "true" S/R, me being one of those. Sorry for the interruption, no further comments :) Excellent stuff that you are giving away for free here.

No apology necessary. Every comment is appreciated. I am not sure what you mean by "true" S/R. I regularly see TL's with multiple touches (a third touch is minimum necessary for confirmation) that result in significant profit each time.
 
Last edited:
What Is Price

What is Price?
In general terms price is a component of an exchange or transaction that takes place between two parties and refers to what must be given up by one party (i.e., buyer) in order to obtain something offered by another party (i.e., seller). Yet this view of price provides a somewhat limited explanation of what price means to participants in the transaction. In fact, price means different things to different participants in an exchange:

Buyers’ View – For those making a purchase, such as final customers, price refers to what must be given up to obtain benefits. In most cases what is given up is financial consideration (e.g., money) in exchange for acquiring access to a good or service. But financial consideration is not always what the buyer gives up. Sometimes in a barter situation a buyer may acquire a product by giving up their own product. For instance, two farmers may exchange cattle for crops. Also, as we will discuss below, buyers may also give up other things to acquire the benefits of a product that are not direct financial payments (e.g., time to learn to use the product).
Sellers’ View - To sellers in a transaction, price reflects the revenue generated for each product sold and, thus, is an important factor in determining profit. For marketing organizations price also serves as a marketing tool and is a key element in marketing promotions. For example, most retailers highlight product pricing in their advertising campaigns.
Price is commonly confused with the notion of cost as in “I paid a high cost for buying my new plasma television”. Technically, though, these are different concepts. Price is what a buyer pays to acquire products from a seller. Cost concerns the seller’s investment (e.g., manufacturing expense) in the product being exchanged with a buyer. For marketing organizations seeking to make a profit the hope is that price will exceed cost so the organization can see financial gain from the transaction.

Finally, while product pricing is a main topic for discussion when a company is examining its overall profitability, pricing decisions are not limited to for-profit companies. Not-for-profit organizations, such as charities, educational institutions and industry trade groups, also set prices, though it is often not as apparent . For instance, charities seeking to raise money may set different “target” levels for donations that reward donors with increases in status (e.g., name in newsletter), gifts or other benefits. While a charitable organization may not call it a price in their promotional material, in reality these donations are equivalent to price setting since donors are required to give a contribution in order to obtain something of value.
 
Hi TD,

I am prone to playing the odd reversal here and there, as we speak I have taken a tweezer/pin long off the round number rejection on USD/CHF.
I absolutely abhor playing these falling knives - have you been prone to taking these and if so how do you train yourself not to?

Cheers,

SMB


SMB,

Look at the last three candles on your chart.

The first one is a doji - it represents indecision and not a firm rejection of a bottom.

The second one is also a doji but this time it has a range expansion. This means the bulls and bears are playing a little more actively now. Volatility is increasing.

The third is a pin bar. It is a pin bar at a double bottom (you cannot see this on the chart you posted. Zoom out and look left).

However, I like to see the nose poke out to create its own space away from the other bars. This is an important element in playing these bars, for me.

As such I would most likely not have taken this setup.

If I had, I would be quick to get my stop to BE on this as I don't consider it an A great setup and 1.1650 (which it is now testing) is first area of difficulty in my opinion.

I will take a reversal against the trend if I feel there is a strong reason to do so.

I never sell because something is too high and I will never buy because it can't go any lower. The market will go where it wants. The only person that can ever be wrong is the trader.

I take many of the factors already outlined in earlier posts into consideration in the rare times that I trade against the trend. Trading against the trend can be very profitable but it can also result in the downfall of a trader. And it is important to remember that it is a very different game to trading with the trend and as such it has different rules.

More on this will develop over time.
 
Last edited:
Status
Not open for further replies.
Top