Making Money Trading

Which market do you want to learn to trade?


  • Total voters
    101
  • Poll closed .
Status
Not open for further replies.
Tips and Tricks *Part 1*

This is that start of a 13 part series called Tips and Tricks which will discuss some of the ways I increase my profitability when trading.

The first area I want to discuss is how to sometimes "cheat" your SB broker for an optimal entry into the market. If you don't spreadbet then you can skip this post altogether as it may not be of much use to you.

Please note that I don't do this every time I trade. Having an opportunity to do so is rare. However, it helps to know that these opportunities exist from time to time and how to exploit them.

First off, I don't want to get everyone sidetracked on how you can all make free money in the markets. For the most part you can no longer do this. There was a time when you could make a huge amount of money trading broker errors but as time goes by, it gets harder and harder to profit from these opportunities.

I've made several posts on this in my time on this forum and written lengthy articles on how to profit from your broker via latency scalping and what I call "untrue volatility", on other forums and it's not something I want to repeat now on this thread. If you want links to these, send me a PM and I will provide them for you.

What I will say is that if you are trading in an unfamiliar market it may help you to spend sometime looking at the PRICE very carefully. To many traders pull up a chart to judge when to enter the market and don't spend anytime looking at the actual bid-offer QUOTE.

As most of you are aware, spreadbetting is a DERIVATIVE of the underlying market - albeit one that is very closely linked most of the time. However, I have found many markets on many different brokers often experience a volatilty that a trader can take advantage of.

I call this "untrue volatility". It is where the price "spikes" to levels that the direct market is not currently trading at and then corrects itself almost instantaneously,

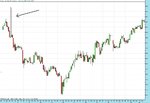
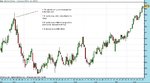
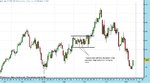
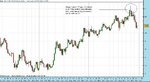
You can see a clear example of this in the charts attached. Chart 1 shows the direct market quote for Spot Gold and chart 2 shows a spreadbet brokers quote for Spot Gold. I have used a red arrow to highlight a 15m period (3 5m bars) on the first chart. The arrows on the second chart correspond to the same time period.

As you can see it would have been possible to make a profit of approximately 50 points in a matter of seconds. Before you get too excited I should say that this happens rarely and nowadays most brokers will reverse your trade if they find out you have done it. You can still sometimes get under the radar but it is more the exception than the rule.

However, rather than using this spiking to get a PROFIT (entering on the spike and closing on the correction - therefore trading the "error") there is a way in some markets to get a BETTER entry into the market you want to trade.

To take a hypothetical example, my broker quotes Spot Gold with a large degree of volatility, at certain times, that means I can usually get a price at least 5 ticks better off than my entry by buying or selling at the market rather than using an order.

If you actually watch the quote alongside a direct market quote you will notice volatility that is SPECIFIC to the sb broker. If spot Gold is trading at 800 you may see the offer come in at 800...800.10...800.20...799.50...800.20...800.30 and so on. The price on some markets jumps around a lot more than this and you have to be fast.

Again, if you are like I was (until yesterday) and busy at work, it will be enough to place an order and walk away. However, if you have time, it is worth looking at the quote for a few minutes to see if you notice anything unusual.

As I said above, this is NOT an important part of my strategy, it is simply something I have become aware of over time and is why I like to look at the actual price quote where I can.
 

Attachments

  • gold_dma.gif
    gold_dma.gif
    14.9 KB · Views: 877
  • gold_sb.jpg
    gold_sb.jpg
    104.5 KB · Views: 932
Well, when I say 2,800% people expect me to have made a lot more money than I actually have.

If you start with £1 and increase it to just £28, you have the same percentage increase.

That is what I mean by the percentage increase masking the capital increase :)
Now I understand... however, a 2,800% increase is still a 2,800% increase! I suppose the point is that you need to look at any possible returns in combination with the risk profile of the strategy that was employed.
 
Well, when I say 2,800% people expect me to have made a lot more money than I actually have.

If you start with £1 and increase it to just £28, you have the same percentage increase.

That is what I mean by the percentage increase masking the capital increase :)

However, trading 1 pound a point making 2,800% or 28 points, is far different from trading 100 lots and making 2,800%.

Lets get a reality check here. Warren Buffet from 1965-2005, has produced an annual average return of 21.5%, which is double the return of the S&P 500

So don't expect to make 2,800% when trading BIG you will think differently when trading SIZE.

Absolutely right, but it is my personal belief (and if you run the numbers I trust you will not disagree substantially) that the retail punter is pretty clear up to £1m in terms of liquidity, execution, and risk. The same strategy which can be traded at £1pp in the bucket shops can be traded on the S&P futures or the interbank FX market up to £1m easily enough risking only 1% of the account per trade. Risking £10k per trade with 100 pip stops is £100pp (10 FX lots or 40 ES contracts).

If T_D runs into problems due to trading size, I'm sure he wouldn't complain too much. I'd love to have those "problems".

Remember that making returns above 20% annual is only done in small accounts due to the high leverage available and the high risk percentage. I'd like to see someone do that on a small account risking < 1% per trade with no more than 10:1 or 5:1 leverage. Risking 10% with 100:1 leverage makes it somewhat easier, although I'm sure we all look forward to the time we can make comfortable returns risking 0.5% per trade.

I'm waffling now. Have a great Christmas guys, and a prosperous New Year!
 
Today was my last day at work.

But I want to let you all into a secret.

A huge dream of mine has come true and I have been given the chance to work as a professional trader.

This is your year.

Hi TD,

Its been good in walking along your footsteps and learning the basics were i was lagging. I have got many valuable information in price action trading and your thread has improved my thoughts in trading a lot.

Really we miss you, at the same time iam so glad that you are getting into your dream into reality and wish you all success. Ofcourse i hope we will be meeting in fibo's getogether (what do u say right?). I have moved to my new london office work and its getting tough time to check charts or trading activity. Over to that have joined a computer course and its keeping my weekends fullday busy in institute in london. (MBA going on parallely). Anyway once when my course finishes , i hope i can get back to this trading with small capital. Lets see whats in store for me in new year.

Wish you all Happy X-Mas, & Wish you all a Happy NewYear(y)

Fxbee
 
Firstly, can I say hello to you all, I'm new and will ask some daft questions...there, said it.

I was hoping for a hard bound book of this thread for christmas! Alas I will have to resort to giving my printer a bashing.

T_D - Thank you. I'm only on page 16 (and will have to read the first 16 pages again) but it makes great reading. Especially as I'm new to this.

Merry Christmas to you all.

Mark.
 
Don't hold your breath waiting for the little hourglass symbol to change to a save/open dialog box though. Took 12 minutes on this long thread! :sleep:. merry xmas all:D

Happy Christmas!

I hope you all had a great day.

Just to remind you - there will be a word document that has all the lessons in it along with a Q&A section that reprints what I think are some of the best questions in the thread. I will get this up sometime within the next few weeks. It will be released in volumes e.g volume 1 will cover pages 1-50 and volume 2 will cover 50-100 etc

I also still intend to get some video up here at some stage. First of all I need to learn how to make something that is a reasonable size. At the moment the file sizes are coming out huge. If anyone can help in this respect it would be much appreciated!

I'm off to do some reading now. One of my personal goals for the New Year is to learn as much as I can about the fundamentals in trading. With that in mind I've going to work through "Economics Explained", "How To Read The Financial Pages" and "If It's Raining in Brazil, Buy Starbucks"...

It's either those or watch the latest Harry Potter ;)
 
Last edited:
I also still intend to get some video up here at some stage. First of all I need to learn how to make something that is a reasonable size. At the moment the file sizes are coming out huge. If anyone can help in this respect it would be much appreciated!
I don't know your level of technical ability - so apologies in advance if any of this is obvious to you!

Here are a few suggestions

  1. File Type
    What file type is your video editing software using? I suspect that you're recording a *.AVI file which is absolutely huge. If so you might want to try converting or recording to *.MPEG which is more highly compressed.

  2. Video dimensions
    Yes this might be obvious, but what size is your video being recorded in? To give you an idea of scale YouTube recommends uploads of 320x240pixels (half screen size).

  3. Colour Settings
    This is usually measured in 'bits'. (A 32-bit colour recording uses more information than 16-bit color).

  4. Frame Rate
    Reducing the number of frames used will help reduce the size. This is measured in 'fps - frames per second'. Try playing around with a lower number.

  5. Interlacing
    If you have the option, turn 'interlacing' on. This effectively cuts down the size of the raw data by 50% (the missing data is interpolated).
Note that all of the above comes at the price of video quality, play with the settings and see what you come up with.
I'm off to do some reading now. One of my personal goals for the New Year is to learn as much as I can about the fundamentals in trading. With that in mind I've going to work through "Economics Explained", "How To Read The Financial Pages" and "If It's Raining in Brazil, Buy Starbucks"
I'm extremely impressed at your work ethic, it's making me feel so guilty so I am now off to do some reading of my own!!! :eek:
 
Tips and Tricks *Part 2*

In the second part of this mini-series I am going to discuss the discretionary element in pin bar trading.

This is something that has been covered in detail throughout this thread. I will merely summarise it here.

A good pin bar should:

- Have a long nose in proportion to its body
- Have its body in the top or bottom third of the range
- Have its close within the range of the previous bar and near to its high or low

See Chart 1 for an example of a pin that meets this criteria.

Pin bars can be played in both TRENDING and SIDEWAYS markets but they should ALWAYS be played at SWING HIGHS or SWING LOWS in both types of markets.

The SWING is THE single most important element for me.

In a TRENDING market a pin can appear at:

a) The end of a SWING as an exhaustion move. Many times when this happens there will be no other supporting factors.
b) The end of a NATURAL REACTION in a trend to indicate that the move is about to resume.

In a SIDEWAYS market the pin should SWING into the support or resistance (see chart 2) it should not DRIFT into it (as it does in chart 3).

I like to see pins appearing at support or resistance, pivotal points where support becomes resistance and vice versa, key fib levels or EMAs. Areas of confluence, which are areas where several levels come together, are particularly powerful. There have been many examples throughout this thread of both these individual elements and confluence.

I play pin bars both WITH and AGAINST the trend and I rarely worry about the size of the stop. It is all relative. The weekly pin that appeared at a swing high in November on GBP/USD had a range of 379 pips but even after the rally of the last two days it is still 823 pips in profit. (see chart 4) That is still well over 2:1 reward/risk.

It always baffles me when people say that they wouldn't take something because the stop would be too large. The only reason I would pass on a large stop is if I could not take it on MINIMUM size and still adhere to my risk management.

The discretionary element in trading pin bars comes from experience. The pin in the last example (weekly Cable) DOES NOT have its close within the previous range. As a result it does not meet ALL my criteria. However, IF I had been able to take it at minimum size, I still would have done. It is times like this when a trader has to make a decision based on their previous observations of the market.
 

Attachments

  • 1.JPG
    1.JPG
    78.3 KB · Views: 1,372
  • 2.jpg
    2.jpg
    75.6 KB · Views: 1,438
  • 3.jpg
    3.jpg
    69.2 KB · Views: 1,379
  • 4.jpg
    4.jpg
    83.5 KB · Views: 1,327
Last edited:
GBP/CHF Trade Update

Some of you may recall the short trade I missed due to an IT issue. The pin bar formed shortly after the MPC minutes, and marked exactly a 50% retrace of the move. I've put TD's 50 hour EMA on the chart, and I note that the pin on that date went through the EMA but failed to close on the other side of it. In addition, the news was bearish for sterling long term, (implies further interest rate cuts), and the carry trades have shown to be shaky of late. The fundamentals and technicals lined up perfectly, and with a BE stop in place that trade would still be open at +400 ish.

Since that blunder, I have been looking for opportunities to get short GBP against CHF. There was a pin bar when the markets opened on Boxing Day, but due to the low volume and interest etc I forced myself to pass on the short signal, which if taken would be currently +130 with the entry never tested. However, I stuck to my plan by not trading on Boxing Day.

Most of the 27th is behind us now, and it will be the 28th further East soon, and spreads seem to be back to normal on the only ECN platform I have access to. I think it is safe now to initiate positions, even though the volume will be lighter than usual.

I'm wary about selling after such a large decline. Even on the longer term, GBP has weakened substantially. However, I have been doing some reading recently, especially Jack D Schwager's "Complete Guide to the Futures Markets". There are many examples there of profitable trades taken as a result of following an established trend. It is not necessary to fish for tops or bottoms. Currencies trend well, and this could be the beginning of a weak year for GBP.

Back to what the chart is telling me. I have a bearish hourly pin bar. The high of this bar isn't at a spectacular level, but it is around the point of the early December lows. Support may have become resistance. More interestingly, this pin was a result of the break of a three bar high - clearly no follow through. There is a three bar low on the chart at the same place. This level also represents a monthly low. A break of the three hourly bar lows would be bearish, and a good place to add to a position.

On the daily charts, the low of today is equal to a series of low of day prints from November which offered significant support. The last two bars to print this price in November formed a bullish DBLHC. A break of this level would be significant.

Longer term, we are 2000 pips off the highs six months ago, but we are close enough to printing a new low for the year. Further support is to be found at the bottom of the 2005/6 consolidation range.

I could be close to selling a bottom here. However, the stop required from this pin is low. Price is heading up, so I can see how the left eye resistance works out- if it holds I'll be even more confident if the pin is triggered.

To get into position for a bigger move, I will pyramid this position if the entry is confirmed by the following:

A daily close below the 3 bar low today (and current LOD).
A break of daily support at 2.2675.
(note - both of these signals will be at a similar price point)

I can risk around £175 on this trade, which will allow me to play with £3pp with 50 pip stoplosses. I am considering entering the initial hourly pin with £2 and adding £1 on the daily support break. I'll try to give this trade some room by not moving the stops too soon. Confirmation on dailies should be enough to keep me in the move.

I've already missed a large portion of the move since the BoE announcement, but there was no technical trigger to get me into the trade, and chasing the market would have had me stopped out. A bearish pin so very near support is a good entry. I'd rather take a pin short into support than try and sell a break below support.

Does anyone have any fundamental or technical theories for major trends in FX for 2008? Commodities are quite special - anyone who bought oil or wheat at the beginning of last year would be retired now, but FX trends well too. I'd quite like to trade longer term this year, taking more of the moves on a larger timeframe, and hopefully working my way up to holding a position for longer than a week (of course, if the market keeps telling me I am right - I don't want to hold for the sake of it).

All this ranting, and it looks like this pin might not even trigger. However, does anyone have any thoughts on my bearish GBP/CHF outlook?
 
Gbp/jpy

To continue my Sterling bashing, I am going through weekly, daily, and hourly charts drawing on 50 EMAs on the higher timeframes, fibs, S/R zones, and trendlines. I've found what I think would be a promising setup if it had happened any other day than Dec 27.

Shown are the 365 Day EMA and the 50 Day EMA. I am wary about this setup because the rejection of the highs is on a light trading day. I've seen worse setups though, and if it still looks like a pin at midnight and the risk is right I may just take a position.
 

Attachments

  • GBPJPY_D.png
    GBPJPY_D.png
    18.2 KB · Views: 559
applying dow pins

Hi folks,
Just thought I'd float this chart observation out to see what you think..
I've seen this sort of thing happen quite a few times now after following TD's thread and guidance on pin formations.

The idea is to wait for an Ema x-over then trade in the direction of the EMA's using pin candles to signal pull-back entries. Take your entry as recent candle high / low is breached. Essentially you're watching for pin bounces off EMA's.

Exit on price / RSI divergence or price / Ema crossover.
As has been pointed out, stop positioning is easy; the pins show us where to put them!

It all looks good of course on today's price action and with hind sight. The real challenge I guess is applying it in real-time and surviving those choppy days when they come along.
(I'm kind of thinking that by waiting for both Ema x-overs and pins, one might be able to keep out of said choppyness.)

The other option today was to play counter trend, going long off the positive divergence and associated pin formation but personally I find this scary and I'm not sure how to exit.

I'm not sure whether the circled candles are particularly high quality pins; the first one has a large body and the last one is sat inside a sort of concave price pattern. I think maybe the second one's not bad though.

Any one else into this? It seems fairly standard stuff. The revelation for me has been the pin candles price action and applying this to flag possible entries.

Best Regards all,
Neil
 

Attachments

  • dow-27-dec-07-1.PNG
    dow-27-dec-07-1.PNG
    27.3 KB · Views: 646
GBP/JPY Live Call

This is not a recommendation to trade.

I have gone short the GBP/JPY, filled on a limit order short at 226.56 on the strength of a break of the daily pin bar. I played the retracement to get a better entry (+10 pips) - this will cost a trade from time to time, but with such a wide stop and long timeframe (daily, 189 pips risk), every little helps.

TD pointed out that these moves tend to come back to BE before they take off again, so I'm leaving this one alone for now. I will be monitoring the hourlies during the day to get a pyramid entry if possible, but for now I am in 1 unit. Trade will be reviewed at end of each day until stopped out.

Stoploss is at 228.45.

I've just noticed that a better entry could have been taken at the close of the 2 hour pin at 2AM GMT. This would have been a 20 point better entry, from a lower TF, allowing a pyramid on the break of the PDL. However, I will just view this as confluence. Bye bye GBP!
 
Trade Update

I have gone short the GBP/JPY, filled on a limit order short at 226.56 on the strength of a break of the daily pin bar.

Hit +100 net of spread so far. The stop was pretty wide, so I couldn't take the trade with more than 1 unit as it would break my risk / reward. I'm not too sure whether to set a stop in at BE or not. I am not used to the daily TF. If this was an hourly trade, I'd have the stop in BE, but since it is a daily I'm reluctant. I should be trailing on the basis of the TF I entered in on. Time to walk away from the screen for a few hours I think (although if I come back to a 200 pip loss from a 100 pip open gain I'll be pretty miffed).

The trading plan was to trail the stop sensibly based on the larger timeframes. Setting to BE now could get me shaken out of the move. It is difficult to leave this open, knowing it could turn into a loser, when my 100 pip per week target has been hit with the first trade and I could take it if I wanted to. Sticking to the plan will keep me in for bigger trends though.

Sterling is weak. On the daily charts, we have a new low and a lower high. We are waiting to confirm the bear market with a lower low. The trend is down. I entered on a solid daily signal. We are near major support, and a break would be an excellent chance to add to a position. I could justify a BE stop as it coincides with the extreme of the last 3 hourly bars.

GBP/JPY heading lower again. Position now worth +120. I can't give all of that back and take a loss. Stop set to BE. Makes sense looking at the chart. Platform off until the morning.

EDIT - 7AM. Covered at 225.74 for +82 net of spread on new hourly high taking out the trailing stop. Reverse pin has also formed on the hourlies, so best to get out. A good trade though.
 
Last edited:
Status
Not open for further replies.
Top