Making Money Trading

Which market do you want to learn to trade?


  • Total voters
    101
  • Poll closed .
Status
Not open for further replies.
Cable TA

From a technical point of view can someone shed light on what is going on here please.

As I see it, we have broken through a sloping bearish channel but bounced off medium term support. Forming a lopsided inv head and shoulders pattern where the neck is potentially resistance offered by the bottom channel tl. Is this Support turning into resistance confirmation or the right side shoulder for a test of previous highs?
Any biases?
Any thoughts?
 

Attachments

  • gbpcbreak.gif
    gbpcbreak.gif
    15.3 KB · Views: 668
OK since two of you lost money on this lets discuss it and I will show you why I didn't take it.

First lets look at the daily. We're heading back up into that S/R pivot. See chart 1

Have a look at chart 2 now. This is the hourly TF. Top red line is the daily S/R pivot.

Lower red line is an S/R pivot specific to the hourly TF.

Finally chart 3. Pin bar forms right in the middle of this area. On the one hand its not particularly close to my daily S/R pivot to give me confidence that this is a firm rejection. On the other its not far above a significant hourly pivot level. Therefore you are shorting directly into potential support.

That is why I passed on this.

Why didn't I listen to my initial instinct? I'm in the wrong frame of mind for the screens today.
 
OK since two of you lost money on this lets discuss it and I will show you why I didn't take it.

First lets look at the daily. We're heading back up into that S/R pivot. See chart 1

Have a look at chart 2 now. This is the hourly TF. Top red line is the daily S/R pivot.

Lower red line is an S/R pivot specific to the hourly TF.

Finally chart 3. Pin bar forms right in the middle of this area. On the one hand its not particularly close to my daily S/R pivot to give me confidence that this is a firm rejection. On the other its not far above a significant hourly pivot level. Therefore you are shorting directly into potential support.

That is why I passed on this.

Many thanks for the analysis. I think I am relying too much on the pin bar itself without reference to s/r zones on longer timeframes.
 
Interesting - I follow suit with my primary method, but have long felt I could improve my success rate by more attention to lower time frames.

The EASIEST way for any trader to improve their success rate is by considering their risk first and then looking at the potential reward on any trade.

The simple fact is that too many traders consider the potential reward first and only then look at the risk.
 
From a technical point of view can someone shed light on what is going on here please.

As I see it, we have broken through a sloping bearish channel but bounced off medium term support. Forming a lopsided inv head and shoulders pattern where the neck is potentially resistance offered by the bottom channel tl. Is this Support turning into resistance confirmation or the right side shoulder for a test of previous highs?
Any biases?
Any thoughts?

It's going sideways.

This is exactly the sort of price action that I try and stay out of.

Sorry for the curt answer it's just a case of write a reply and see five more posts :)
 
That trade would have turned out quite well. Did you take it?

Hi Lurker,
Yes, I took the trade and exited +30pips. Entry 97.79, exit at 98.09 - the high of yesterday's Europe / US sessions. Following TD's method has really improved my entries Problem now is to get better at trade management and exits. I often leave money on the table by getting out too soon. I don't yet feel confident enough in my ability to identify the right S/R levels and pivots. How is your pin bar alert system going?
Cheers,
NT
 
Trade update: *March Wheat*

Stop on second position was hit yesterday at 868 giving me +22 (£110)

Stop on initial position now moved to 865 which is just beneath the low of the recent range.
 
Last edited:
Im aware that this thread was meant to be instruction on a technique. It seems now its a coaching session and a trading journal for lurker lurker. This has made the thread extremely long and difficult to read.

TD you are too kind to other members, but excellent work anyway.
 
Im aware that this thread was meant to be instruction on a technique. It seems now its a coaching session and a trading journal for lurker lurker. This has made the thread extremely long and difficult to read.

TD you are too kind to other members, but excellent work anyway.

Hi chocobot,

I realise the it is very long. I think that happens to most threads in the end as people come onboard and ask questions, post potential setups and discuss trades they have made.

The last thing I want to do is discourage anyone from posting.

The strategy is out there now and it is to be expected that people will want to understand it as well as they can.

A kind reader who has collected all the "lessons" into one document has contacted me with the intention of sharing it with you all. So once I have reviewed it we will get that up here.

Tom
 
Develbis / Nunrgguy,
In my view, having read through the thread, I think TD has already dealt with the issues you have raised as best he can. We can't expect fool-proof answers to everything - no strategy is that perfect!
It might help you if you read through the entire thread before posting questions.
NT
:) Ok. Will do. As I said in my original post, apologies if already covered.
Re Spreads...CMC cash bet on EurDollar is 2 pips. Futures is 8....that was a typo so yes, in that respect for a short term trade the cash bet is the one to take.
 
well done lurker, we're all learning!

Thanks. I think I could have managed that trade better given that it went as high as +180, but I'm happy with the result for now. Pin bar forming on the GBPJPY, which I am considering taking. Near double bottom / S/R pivot. Risk about 60 pips. Target 1 70 pips, target 2 at 228.45.
 
Thanks. I think I could have managed that trade better given that it went as high as +180, but I'm happy with the result for now. Pin bar forming on the GBPJPY, which I am considering taking. Near double bottom / S/R pivot. Risk about 60 pips. Target 1 70 pips, target 2 at 228.45.

Stop moved to BE as resistance was rejected. If it gives it another test, great, otherwise I'll be out for BE. Again, wishing I was trading multiple units so I can scale out.

Off to bed, will check position at 7 (although I'll have been stopped by then).
 
Thanks. I think I could have managed that trade better given that it went as high as +180, but I'm happy with the result for now. Pin bar forming on the GBPJPY, which I am considering taking. Near double bottom / S/R pivot. Risk about 60 pips. Target 1 70 pips, target 2 at 228.45.

Cover for +50 heading into resistance. Off to bed.
 
Stop moved to BE as resistance was rejected. If it gives it another test, great, otherwise I'll be out for BE. Again, wishing I was trading multiple units so I can scale out.

Off to bed, will check position at 7 (although I'll have been stopped by then).

And if I had just done that, left the stop where it was, and gone to bed I'd have come back now to +130 open rather than the +50 I covered for.

I'm still getting out too soon. I managed to hold my wheat trade for three full days, but that is the only time recently I've shown any restraint with an exit. I'm self destructive, and I'm snatching at small profits. I know it will ruin me eventually. HELP!
 
And miles to go before I sleep...

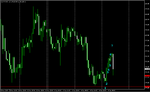
Just a quick post to point out two things. First, my BE stop would have been untouched had I left it there, even after that pretty spectacular fall. Second, my* mechanical trailing stop system (trail stop to low [high] of previous bar if price makes a new high [low], otherwise leave stop in place) on the hourly chart would have kept me in the trade until the break of the low of the opposing pin, which would also have been a signal to reverse.

As I was once a keep player of chess, it may perhaps be helpful to me to list the correct way to manage this trade, along with the chart for future reference.

1: This is the pin bar bar. Place buy stop at 226.03, with a contingent sell stop down at 225.52
2: Price makes new high, raise stop to low of bar at 225.76 on close of bar
3: Price makes new high, raise stop to low of bar at 226.29 on COB. This is now a "free trade" with +26 locked in (or +18 with the bucket shop spread added)
4: Price makes new high, raise stop to low of bar at 226.40 on COB.
5: Price makes new high, raise stop to low of bar at 226.60 on COB.
6: Price does not make new high, leave stop in place at 226.60.
7: Price makes new high, raise stop to low of bar at 226.92 on COB. Note the reverse pin bar. While the long trade will be wrong if this low is violated, depending on where the tail is in relation to S/R it may be advisable to add another sell stop to reverse at 226.92. Had I been around to see that signal, I would most likely have taken it short.

A simple method to trail a stop up, checking the screen on each bar close, and not between, would have made a very nice 89 pips before spread, or £81 per £1pp in the bucket shops. A reversal on the break of the bar would now be around +50, and could be managed in the same way.

Tell me ladies and gentlemen, is there any reason why I should not have been able to make better profits by trailing a stop properly? I'll learn one day. The question is can I learn and become profitable before I blow my account? I need more pips average win to justify the stop size and the average loss size, otherwise I don't have a positive expectancy.

* - this is a system I use, not one I invented
 

Attachments

  • GBPJPY_H1.png
    GBPJPY_H1.png
    14.6 KB · Views: 672
Status
Not open for further replies.
Top