You are using an out of date browser. It may not display this or other websites correctly.
You should upgrade or use an alternative browser.
You should upgrade or use an alternative browser.
Making Money Trading
- Thread starter trader_dante
- Start date
- Watchers 334
- Status
- Not open for further replies.
superspurs
Established member
- Messages
- 618
- Likes
- 139
ved update
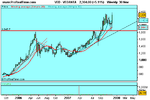
well i added 50 shares to the isa @ 2003 on tues 20th.price went down as low as 1850,nearly took me out,but looking very nice now.i just noticed that little gem about merging candles to form pins from the wheat update.thx
The zoomed out chart adds strength to the S/R pivot and this combined with the confluence of fib levels makes this a high probability trade.
Thanks for posting superspurs.
Tom
well i added 50 shares to the isa @ 2003 on tues 20th.price went down as low as 1850,nearly took me out,but looking very nice now.i just noticed that little gem about merging candles to form pins from the wheat update.thx
Attachments
Last edited:
trader_dante
Veteren member
- Messages
- 4,535
- Likes
- 1,704
Hi TD,
Pls have a look at this pin in gbpusd . This week its forming like a pin, yet we have time & will know at the end of week, has touched 50% fib (second circled pin). I am not sure of this second pin as its already rallying down & this pin like formation, what does it signals actually...? Your views appreciated.
Fxbee
Hi Fxbee,
I don't think this is a good enough pin to trade. It doesn't poke far enough away from the other bars around it.
trader_dante
Veteren member
- Messages
- 4,535
- Likes
- 1,704
This move on the dow seemed to have quite a few features:
- bounce off yesterday's resistance @ 13225
- small retrace at 'g' with a sort of gap fill thingy.
- re-test of 13270, also a support region from yesterday.
- finally enough momentum to see off 13300 and 13320 resistance
Unfortunately I couldn't hold on to the whole move, but there you go.
Sorry if this is tedious, it's just that I'm excited 'cause I've never been able to spot this stuff before. Am I reading too much into it?
Neil,
You're reading the chart very well by the looks of things.
You're certainly not reading too much into it.
Prepare your chart and wait for the market to come to you.
trader_dante
Veteren member
- Messages
- 4,535
- Likes
- 1,704
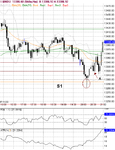
Blimey, another one.
Straight off S1 support.
Any body else play this one? I had 30pts at one stage but played stop too tight and was taken out for +14.
I think you managed this trade fairly well by the looks of things 🙂
trader_dante
Veteren member
- Messages
- 4,535
- Likes
- 1,704
well i added 50 shares to the isa @ 2003 on tues 20th.price went down as low as 1850,nearly took me out,but looking very nice now.i just noticed that little gem about merging candles to form pins from the wheat update.thx
That's a superb trade superspurs. Well done. Great stuff!
You lot are going to leave me behind. lol
superspurs
Established member
- Messages
- 618
- Likes
- 139
hey td,being as your not a bad coach,if you get an hour spare,get down to white hart lane and have a word with our defenders.🙄
trader_dante
Veteren member
- Messages
- 4,535
- Likes
- 1,704
hey td,being as your not a bad coach,if you get an hour spare,get down to white hart lane and have a word with our defenders.🙄
I'll pop down there superspurs and give 'em my advice:
I'll say:
Lads,
- Analyse the situation
- Wait for the action to come to you
- Strike
You need to play good DEFENSE, not OFFENSE
...reminds me of something else lol
Good luck for Sundays game 🙂
However, yesterday when I saw it failed to hold above the 900 round number and S/R pivot and formed a two bar pin bar (the two bars if combined into one would form a pin bar), I sold £5 short in another account.
Hello TD, could you elaborate further on a two bar pin bar, not quite sure what they are.
Thanks.
trader_dante
Veteren member
- Messages
- 4,535
- Likes
- 1,704
Two bar pin bars
Sure Paresh,
A two bar pin bar (not sure why I talk about bars when I use candles - guess its because I was taught in bars) is relatively simple.
As you know a pin bar has a long nose with a small body near the extreme of the range.
This pattern can sometimes be made over the course of two seperate bars. That is to say, if the bars were re-drawn to form one bar, it would be a pin bar.
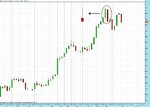
If you get a long bullish bar that is immediately followed by a long bearish bar that closes near where the bullish bar opened, then it becomes a two bar pin bar.
Have a look at the chart attached. The pin bar I have drawn mirrors the action in those two bars.
Hello TD, could you elaborate further on a two bar pin bar, not quite sure what they are.
Thanks.
Sure Paresh,
A two bar pin bar (not sure why I talk about bars when I use candles - guess its because I was taught in bars) is relatively simple.
As you know a pin bar has a long nose with a small body near the extreme of the range.
This pattern can sometimes be made over the course of two seperate bars. That is to say, if the bars were re-drawn to form one bar, it would be a pin bar.
If you get a long bullish bar that is immediately followed by a long bearish bar that closes near where the bullish bar opened, then it becomes a two bar pin bar.
Have a look at the chart attached. The pin bar I have drawn mirrors the action in those two bars.
Attachments
trader_dante
Veteren member
- Messages
- 4,535
- Likes
- 1,704
Two bar pin bars *continued*
If it makes it easier, it's just like imagining what you would see if you were looking at a two hour TF rather than a one hour.
It's the same principle.
The 4hr TF is just FOUR one hour bars put together.
The 15m TF is just 15 1m bars put together.
So if I said to you "I'm trading the 5m bars and I've just spotted an excellent 2 bar pin bar" all you would need to do to see it, most of the time, is to look at your 10m TF 🙂
Last edited:
any trades looking good ?
nice pin just formed on H1 EUR/USD, and also one of those 2 bar pins TD mentioned a few days ago is now on H1 GBP/USD, but that needs a wide stop and it's already moved 30 pips past entry
trader_dante
Veteren member
- Messages
- 4,535
- Likes
- 1,704
hi td
any trades looking good ?
Nothing so far but I think there could be some good plays this week. I'll post some charts of what I am looking at shortly...
trader_dante
Veteren member
- Messages
- 4,535
- Likes
- 1,704
Ftse
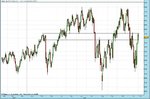
Thought I'd post this up since I realise that I've let all those people down that voted for indices by hardly mentioning them.
The chart I look at has many more S/R pivots than are shown here. I have simply drawn the ones nearest to the price.
Chart 1 is daily TF.
Chart 2 is where we are on the hourly TF.
Please note that I am WATCHING this, NOT TRADING it.
Attachments
Thought I'd post this up since I realise that I've let all those people down that voted for indices by hardly mentioning them.
The chart I look at has many more S/R pivots than are shown here. I have simply drawn the ones nearest to the price.
Chart 1 is daily TF.
Chart 2 is where we are on the hourly TF.
Please note that I am WATCHING this, NOT TRADING it.
I hope you will forgive me for not using the hourly chart to identify pins. I have a problem with stop distances, as you will know. Purely mental, but still....😕
I used the 15' chart and got two, what I took to be pin trades, out of them, with a lot of success. The long one is still open and has been slower than the earlier short but I live in hopes.
Split
nine
Senior member
- Messages
- 2,049
- Likes
- 510
Dante,
Doesn't this imply that any time you get a "sharp" price excursion that returns into the initiating range we have a pin-bar on some timescale. Effectively a rejected price to a Market Profile person.
I don't disagree but I wonder what your opinion is on this statement: "a pin-bar will be more important if it is perceived as such by a large number of traders" and its implication that we should look at the timescales watched by large numbers of traders?
Sure Paresh,
A two bar pin bar (not sure why I talk about bars when I use candles - guess its because I was taught in bars) is relatively simple.
As you know a pin bar has a long nose with a small body near the extreme of the range.
This pattern can sometimes be made over the course of two seperate bars. That is to say, if the bars were re-drawn to form one bar, it would be a pin bar.
If you get a long bullish bar that is immediately followed by a long bearish bar that closes near where the bullish bar opened, then it becomes a two bar pin bar.
Have a look at the chart attached. The pin bar I have drawn mirrors the action in those two bars.
trader_dante
Veteren member
- Messages
- 4,535
- Likes
- 1,704
Hello nine,
Yes I suppose it does.
It is certainly my belief that any pattern or price action setup will be more important if it is perceived by a large number of traders.
That is why I try and keep my technical analysis as simple as possible. One reason among many that I don't like technical indicators is the sheer number of them.
I DON'T KNOW whether large numbers of traders are using RSI, Stochastics, MACD, Momentum or Bollinger Bands but I DO KNOW that they are ALL watching price in some form or another.
That is why I also try to use only the most obvious trendlines and support/resistance pivots on my charts otherwise I will always be wondering, have all the other big fish seen my beautifully curve fitted trendline that connects three extreme lows or have they instead used one 150 points higher that connects seven extreme lows but intersects four others?
However, just because an area becomes more important that doesn't mean I think it will be more RELIABLE as a signal.
Maybe every single trader in the world that uses technical analysis saw the ascending triangle on Eur/Gbp that I took long but how do you know how the majority will act?
Will they buy the break? Sell the break? Wait for a retest?
I have no doubt that huge numbers of traders play these bars because they represent a reversal. Traders watch reversals very carefully. Why? Because reversals, for the most part, make longs and shorts nervous. But is it the pin bar that is important or is it the level that the pin bar appears at that is key? And that doesn't solve the problem of knowing what timescales large numbers of traders watch.
Doesn't this imply that any time you get a "sharp" price excursion that returns into the initiating range we have a pin-bar on some timescale. Effectively a rejected price to a Market Profile person.
Yes I suppose it does.
I don't disagree but I wonder what your opinion is on this statement: "a pin-bar will be more important if it is perceived as such by a large number of traders" and its implication that we should look at the timescales watched by large numbers of traders?
It is certainly my belief that any pattern or price action setup will be more important if it is perceived by a large number of traders.
That is why I try and keep my technical analysis as simple as possible. One reason among many that I don't like technical indicators is the sheer number of them.
I DON'T KNOW whether large numbers of traders are using RSI, Stochastics, MACD, Momentum or Bollinger Bands but I DO KNOW that they are ALL watching price in some form or another.
That is why I also try to use only the most obvious trendlines and support/resistance pivots on my charts otherwise I will always be wondering, have all the other big fish seen my beautifully curve fitted trendline that connects three extreme lows or have they instead used one 150 points higher that connects seven extreme lows but intersects four others?
However, just because an area becomes more important that doesn't mean I think it will be more RELIABLE as a signal.
Maybe every single trader in the world that uses technical analysis saw the ascending triangle on Eur/Gbp that I took long but how do you know how the majority will act?
Will they buy the break? Sell the break? Wait for a retest?
I have no doubt that huge numbers of traders play these bars because they represent a reversal. Traders watch reversals very carefully. Why? Because reversals, for the most part, make longs and shorts nervous. But is it the pin bar that is important or is it the level that the pin bar appears at that is key? And that doesn't solve the problem of knowing what timescales large numbers of traders watch.
Last edited:
trader_dante
Veteren member
- Messages
- 4,535
- Likes
- 1,704
Lurker!
Tell me you're still short Wheat.
Tell me you're still short Wheat.
- Status
- Not open for further replies.
Similar threads
- Replies
- 3
- Views
- 2K