trader_dante
Veteren member
- Messages
- 4,535
- Likes
- 1,704
Trade update *Wheat*
Lets have a detailed look at this position that I still have open.
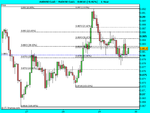
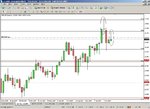
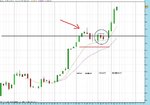
Take a look at chart 1
This is an hourly chart. The horizontal line that runs through the middle of it is an S/R pivot on the daily TF.
As Fridays session closed you can see that although price had broken this level, the market had come off the highs.
As Monday opened it is clear that the market runs into difficulty and prints a series of successively lower highs that were just holding above the pivot (see arrow in red).
This was a warning to me to move my stop in closer.
As a result, I decided to bring it in tight to 826 (red line). There were several reasons I put it here:
- It was my breakeven point (remember December Wheat closed me out for 35 cents profit (£175) and this is where my March contract was opened.
- It gives price some room to react to the S/R pivot. Remember these areas are more like zones. You should give them some leeway. How much is down to the individual trader.
- If the trend is strong, normally price will hit the 10 EMA and continue on its way. Therefore I put my stop behind this.
Price then moved lower throughout the day but held at the 10 as anticipated.
Tuesday afternoon price moves back up off the 10 and through the resistance. Now at this point I decided to make an aggressive move.
Wheat has performed very well for me and as I wrote earlier, when I am right on a market I want to make as much money as I can.
You will see that price formed a THREE BAR HIGH in the afternoon with the highs just above the pivot (see circled candles).
You can view a TWO or THREE BAR HIGH as a CONTINUATION PATTERN. If price breaks it (in this case higher) you would anticipate a trend continuation. As it has the added confluence of appearing at a pivot I decided to put an order to DOUBLE my position on a break.
I put my corresponding STOP order on the new position at the same place as the position already open.
The order triggered on the next bar giving me a net long position of £10 a point.
I had a little concern that I had bought a fake out when the entry candle closed at the low but price resumed its climb into the close.
Wednesday price went LIMIT UP giving me a profit of:
+ 55 cents (£275) on position 1
+ 35 cents ((£175) on position 2
The stop for my first position remains at 826. I have moved the stop on the second to breakeven at 846.
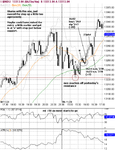
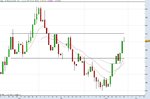
Chart 2 shows the S/R pivots on the March contract. (Ignore the current day which shows a pin forming as it is the result of electronic trading pre-market open).
Lets have a detailed look at this position that I still have open.
Take a look at chart 1
This is an hourly chart. The horizontal line that runs through the middle of it is an S/R pivot on the daily TF.
As Fridays session closed you can see that although price had broken this level, the market had come off the highs.
As Monday opened it is clear that the market runs into difficulty and prints a series of successively lower highs that were just holding above the pivot (see arrow in red).
This was a warning to me to move my stop in closer.
As a result, I decided to bring it in tight to 826 (red line). There were several reasons I put it here:
- It was my breakeven point (remember December Wheat closed me out for 35 cents profit (£175) and this is where my March contract was opened.
- It gives price some room to react to the S/R pivot. Remember these areas are more like zones. You should give them some leeway. How much is down to the individual trader.
- If the trend is strong, normally price will hit the 10 EMA and continue on its way. Therefore I put my stop behind this.
Price then moved lower throughout the day but held at the 10 as anticipated.
Tuesday afternoon price moves back up off the 10 and through the resistance. Now at this point I decided to make an aggressive move.
Wheat has performed very well for me and as I wrote earlier, when I am right on a market I want to make as much money as I can.
You will see that price formed a THREE BAR HIGH in the afternoon with the highs just above the pivot (see circled candles).
You can view a TWO or THREE BAR HIGH as a CONTINUATION PATTERN. If price breaks it (in this case higher) you would anticipate a trend continuation. As it has the added confluence of appearing at a pivot I decided to put an order to DOUBLE my position on a break.
I put my corresponding STOP order on the new position at the same place as the position already open.
The order triggered on the next bar giving me a net long position of £10 a point.
I had a little concern that I had bought a fake out when the entry candle closed at the low but price resumed its climb into the close.
Wednesday price went LIMIT UP giving me a profit of:
+ 55 cents (£275) on position 1
+ 35 cents ((£175) on position 2
The stop for my first position remains at 826. I have moved the stop on the second to breakeven at 846.
Chart 2 shows the S/R pivots on the March contract. (Ignore the current day which shows a pin forming as it is the result of electronic trading pre-market open).
Attachments
Last edited: