Making Money Trading

Which market do you want to learn to trade?


  • Total voters
    101
  • Poll closed .
Status
Not open for further replies.
Hi Paul, thanks for your post!

One problem with these threads is that people post up charts (as is already happening here) and enquire about the validity of, or opinions on, potential setups. This is not much use to others that find this thread weeks, months or even years later since it is rare that follow up charts are posted to show what happened to the market after it was discussed.

Hi TD,

I agree with your points, i had the problem in J16 thread and people started coming up with more charts to check for validity whether is this right or not etc, i dont blame anyone as everyone is eager to learn about it. Even myself posted few charts about identifying pinbar setup, may be when i get the core essence of identifying then i keep quiet and can help others, again newbies to learn will post more charts and check for validity. I feel if you start a separate thread just to check the charts and continue your trades and setting in this thread would be useful for everyone even after they see this thread after some months or years would give clear idea of your charts in this thread.

Again its upto you to decide and show us the path which is effective for everyone of us.

Have a good weekend buddy
Fxbee
 
Price Action

Hi T_D, I always look forward to your price action analysis. I followed the J16 stuff but you have put it in a much easier way to understand. Don't really trust lagging indicators. They seem like a idea to add weight to a decision, without any reasoning. Looking at your preferred Markets, day-in day-out, is a hard slog but the only way to learn, Look forward to future posts.

Dave
 
As new traders find out very quickly, the market very rarely goes straight up or straight down.

Even in a heavily trending market like Crude oil is you will see the price move UP, RETRACE AND/OR CONSOLIDATE and move ON.

This is the very basic rhythmn of the market and drawing on lines where price has flipped between support and resistance is just one way of identifying it.

Before you read on, go back and read this post: http://www.trade2win.com/boards/showpost.php?p=366414&postcount=99

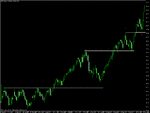
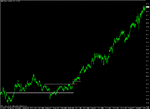
Now look at the chart below.

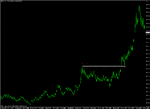
The S/R lines on the previous chart ran from left to right across the screen. However, when you redraw them in to show only the actual resistance and support areas and how they change, you will often see what looks like STEPS in trending markets.

The chart below shows solid support over three consecutive days close above our previous HIGHS. This is a good sign that the market is APPROVING of the higher level and indicates that it is finding support there.

Think of someone frail going up the stairs in the dark in an unfamilar house with weak flooring. Just like the market, that person is unsure of whether there will be a step infront of him, how many there will be and how strong they will be. They will slowly put their foot out to feel for a step. When they find it, they will test it by putting their weight on it. When they are sure it will hold they bring their other foot up and out for the next step...

Bearing in mind everything I have just written, which approximate area do you think marks the top of the next step? Where did price meet resistance before it broke through?
 

Attachments

  • oil1.gif
    oil1.gif
    19.4 KB · Views: 2,851
Last edited:
Crude Oil *continued*

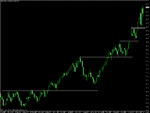
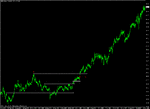
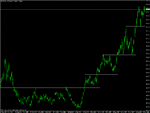
The market retraces to the old highs and then takes off.

These STEPS are price pivots.

Price can and often does, turn at them. You can combine them with price action for very reliable setups.
 

Attachments

  • oil2.gif
    oil2.gif
    18.4 KB · Views: 2,359
Last edited:
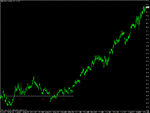
This is a chart of the stock of Hewlett Packard.

As you can see, trading price action works just as well when the market is moving SIDEWAYS as when it is TRENDING.

It often helps to take a step back when you look at the market. Zoom out on your charts and look for the key levels.

Remember, these levels will rarely be tested to the actual tick. They are better viewed as ZONES.
 

Attachments

  • hewlett packard_1.gif
    hewlett packard_1.gif
    19.8 KB · Views: 2,473
Last edited:
Hewlett Packard *continued*

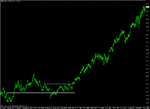
As the market was TURNING around the lower S/R zone, it was CREATING another one above.

When the market eventually broke out of it look at how it, in turn, was tested and the previous RESISTANCE turned into SUPPORT.
 

Attachments

  • hewlett packard_2.gif
    hewlett packard_2.gif
    19.2 KB · Views: 2,000
Hewlett Packard *continued*

Be aware that the LENGTH of consolidation periods is vastly different.

Our job is not to ANTICIPATE so much as be aware of the levels and REACT when we get a setup.
 

Attachments

  • hewlett packard_3.gif
    hewlett packard_3.gif
    19.1 KB · Views: 1,465
Hewlett Packard *continued*

Look for tests of previous highs. The market will do this time and time again.
 

Attachments

  • hewlett packard_4.gif
    hewlett packard_4.gif
    19.2 KB · Views: 1,943
Hewlett Packard *continued*

Market technicians have been describing the rhythmn of the market in many different ways.

In the early 1900s Charles Dow established the concept that all fundamental supply and demand factors are assimilated into the price action and drew an analogy between the behaviour of market prices and the ocean, describing the primary trend in terms of the tide, with secondary trends like the waves that follow the tide successively higher onto the beach

Nicolas Darvas who made $2m (and wrote a book about how he did it, imaginatively entitled "How I made $2,000,000 in the Stock Market") called these levels BOXES.

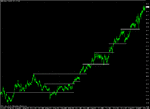
His fundamental theory was simple: Price moves in a range. The highs and the lows of that range form a box. When price moves up (or down) out of that box it will move into a new box. These boxes will stack up on top of each other in a bull market and the reverse will be true in a bear market.

What we are doing here is very similar. See how each step forms a staircase over time...
 

Attachments

  • hewlett packard_5.gif
    hewlett packard_5.gif
    19 KB · Views: 1,967
Last edited:
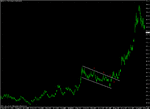
Here is another example. This time in Wheat.

If a pattern is clearly visible, when it breaks out, you will OFTEN but not ALWAYS get a test of that level.
 

Attachments

  • wheat1.gif
    wheat1.gif
    17.2 KB · Views: 2,410
Wheat *continued*

Price breaks out of multi-year highs, experiences some choppy consolidation, moves briefly higher and then decides to test the break out level properly first.
 

Attachments

  • wheat2.gif
    wheat2.gif
    16.5 KB · Views: 2,068
Soyabeans

As you can see, I like commodities ;)

Look at how each time the highs are tested.
 

Attachments

  • soya.gif
    soya.gif
    20.4 KB · Views: 2,238
Hi TD,

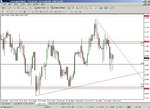
COlor normally for visual representation says whether is bull/bear candle, when identifying pinbar, if pinbar is bull candle with long tail and shows the market trend to buy on rally down trend....Is that ok to go for it... (hope you got what i am coming to say). I was under the impression that bear candle or bar would represent pinbar for taking bull position ... i also feel bearish or bullish candle has nothing to intrepret in pinbar...! pls clarify, though a bit of confused :rolleyes: on seeing one GBPCHF on 4HR timeframe. Circled candle appears to be a perfect pinbar setup peek thru 50% fib but candle is green(bull candle)...whats your view on it TD...

Fxbee
 

Attachments

  • Pinbar7.JPG
    Pinbar7.JPG
    114.7 KB · Views: 1,276
Hi TD,

COlor normally for visual representation says whether is bull/bear candle, when identifying pinbar, if pinbar is bull candle with long tail and shows the market trend to buy on rally down trend....Is that ok to go for it... (hope you got what i am coming to say). I was under the impression that bear candle or bar would represent pinbar for taking bull position ... i also feel bearish or bullish candle has nothing to intrepret in pinbar...! pls clarify, though a bit of confused :rolleyes: on seeing one GBPCHF on 4HR timeframe. Circled candle appears to be a perfect pinbar setup peek thru 50% fib but candle is green(bull candle)...whats your view on it TD...

Fxbee

Hi Fxbee,

Not sure if I understand you correctly but I have found in my experience that the colour of the body of the candle has no relevance on the direction we anticipate the market to move in.
 
Last edited:
Charts Query

Hello TraderD.

A quick question on your charts set up. What sort of time period do you view the charts backwards for drawing S/R lines, FIB Lines.

E.g For Daily do you go back a month or so.
For Hours do you back just the current day ?

Thanks
 
Hello TraderD.

A quick question on your charts set up. What sort of time period do you view the charts backwards for drawing S/R lines, FIB Lines.

E.g For Daily do you go back a month or so.
For Hours do you back just the current day ?

Thanks


Hi jitasb,

I go back as far as my data allows. In most cases this means that for daily charts I go back about two years and for hourly I go back about a month.

In some futures months I don't have a large amount of historical data so I will base my decisions on what is available.

The more data you can see though, the more informed you are.

On each TF zoom out so you can fit all the data on the screen and look for any clear S/R pivot levels. In most cases they are immediately obvious.

Let me know if you want more examples and if you have a specific market in mind and I will post some charts.
 
Hi Fxbee,

Not sure if I understand you correctly but I have found in my experience that the colour of the body of the candle has no relevance on the direction we anticipate the market to move in.

HI TD,

Thanks for your reply, I meant to ask if a pinbar is formed and signals to go long (which means it was rallying down) and the pinbar is bearish candle / bearish colored, does it have any impact on taking our price action entry to go long & vice versa?

I understand the color is nothing to do with price action trade entries ... just frames the sentence to make sure what i was trying to query you, as it was not clear to you in my previous post.

Fxbee

Hi Fxbee, as stated above, whether the body is bullish/bearish doesn't affect my decision in taking the trade.
 
Hi TD,

Randgold Resources

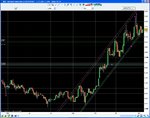
Pinbars at the key S&R pivots (aka RBS)? TD please confirm!

Multi year chart for context.
 

Attachments

  • Randgold Res daily 061107.JPG
    Randgold Res daily 061107.JPG
    172 KB · Views: 1,624
  • Randgold Res daily big pic.JPG
    Randgold Res daily big pic.JPG
    183.9 KB · Views: 1,346
Hi TD,

Randgold Resources

Pinbars at the key S&R pivots (aka RBS)? TD please confirm!

Multi year chart for context.

Fib, This is an absolutely cracking chart with some great examples of pin bars at key levels.

I circled two others that would have been very profitable trades.
 

Attachments

  • Randgold%20Res%20daily%20061107.JPG
    Randgold%20Res%20daily%20061107.JPG
    173 KB · Views: 2,831
Status
Not open for further replies.
Top