What's your view on its next direction?Oil prices dropping as expected.
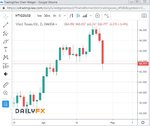
in my opinion we have a high to lower high square out from 63.37 to 63.31 in 36 bars for a sell move and the square root readings are good on a 1 hour chart so it looks good from here at this moment in time
You're right. I use daily and weekly charts, sometimes 4 hour. Intraday trading brings much risk. This is why 90% lose.Sounds a bit complicated but I hope you manage this mess and trade in profit. I tend to use naked eye and concentrate exclusively on price action to eliminate redundant signals like ones that came from indicators.