Long-term and Short-term Setups

TriciaWilson

Active member
Messages
123
Likes
11
Hello Traders,
I’m a pro with 7+ years of experience in the market. I want to help out retail traders. So, here I post some of my long-term and short-term setups and crisp points of the reasoning and my conclusion. Hope it benefits you.


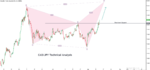
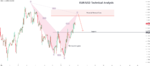
CAD/JPY Technical Analysis
~~ The counter has recovered from the lows with a strong V-shaped rally.
~~ It has now crossed a critical resistance level of 80.162.
~~ The structure resembles a bearish shark pattern and we expect the pair to rally to the completion zone for now.
 

Attachments

  • freeanalysis.png
    freeanalysis.png
    90 KB · Views: 258
EUR/USD Technical Analysis

~~ The counter has been rising sharply from the low.
~~ The entire structure looks like a bearish cypher pattern.
~~ We expect the pair to face resistance at the reversal zone marked in the chart and move back to support level.
 

Attachments

  • freeanalysis.png
    freeanalysis.png
    85 KB · Views: 239
GBP/USD Technical Analysis

~~ The counter is forming a descending triangle at the high.
~~ It made a fake-out at the resistive trendline and then sold off only to form a bearish flag pattern in the near-term.
~~ We expect the bearish flag to break down and the price to move to the short-term support zone.

freeananalywas.png
 
AUD/USD Technical Analysis

~~ As we mentioned earlier, AUD/USD has formed a gramophone pattern.
~~It has now formed an inverted head and shoulder pattern the supportive trendline and has broken out.
~~ And the RSI indicator has also replicated the same pattern, which validates the strength in the counter.
~~ Further, the prices are now trading above a strong support level of 0.71727.
~~ Hence, we expect the pair to be bullish from here on.


free analysis.png
 
USD/CAD Technical Analysis

~~ The counter has been trading with a bearish bias for long.
~~ The down move can be plotted with a pitchfork and the pair is making its last leg of the move down.
~~ Hence, we advise traders to go long at the lower parallel.
~~ And the upswing has a great chance to break the upper end of the range.

freeanalysis.png
 
EUR/USD Technical Analysis

~~ The counter has made a bullish breakout from the consolidation.
~~ It is now taking support and broken resistance, which is a powerful sign.
~~ Further, the consolidation can be interpreted as wave 4 and it is gonna make a move to wave 5.
~~ Hence, we expect the pair to be bullish in the near-term


freeanalysis.png
 
GBP/NZD Technical Analysis

~~ The counter has formed a topping out formation in the near-term.
~~ It made a double top and has broken a key support level of 1.99508.
~~ Further, the round number of 2.00 can act as psychological barrier in the near-term.
~~ Though a pullback to the top cannot be ruled out, we still expect the pair to be bearish in the near-term.


freeanalysis.png
 
NZD/JPY Wave Analysis

~~ The counter is currently formed a flat ABC corrective wave.
~~ It broke out from a bear flag pattern, tested the broken support, and is now coming down with strong momentum.
~~ Hence, we expect the pair to be bearish in the near-term.


freeanalysis.png
 
EUR/JPY Technical Analysis

~~ The counter had multiple supports- trendline, bullish flag support and price action support.
~~ But it has broken all the levels and bulls are trapped big time.
~~ Hence, we expect some long unwinding move in the counter.


1598012894445.png
 
NZD/USD Technical Analysis

~~ The counter is currently is descending channel pattern.
~~ It hit the lower parallel and bounced off with a ascending channel pattern.
~~ Hence, we expect the pair to trade with positive bias in the short-term.


ANALYSIS.png
 
USD/CHF Technical Analysis

~~ The counter is currently in sideways consolidation.
~~ It made a false breakout at the lower end of the range and has crept in and now forming a symmetrical triangle pattern.
~~ We expect the triangle to render a bullish breakout and push the price to upper end of the range for now.

ANALYSIS.png
 
EUR/GBP Technical Analysis

~~ The counter is currently consolidating in a wedge pattern.
~~ It hit the lower end of the range, formed an exhaustion candle and rose up sharply.
~~ Now, it is sliding to a demand zone where we expect buying activity to resume in the counter.

EURGBP.png
 
EUR/CAD Technical Analysis

  • The counter is currently sliding down in a descending channel.
  • It hit the upper parallel and is coming down strongly.
  • Further, the RSI indicator has formed a head and shoulder pattern.
  • Hence, we expect the pair to be bearish in the near-term.

analysis.png
 
NZD/USD Technical Analysis

~~ As suggested earlier, the counter found support at the supportive trendline and bounced off.
~~ Now, it has broken the resistive trendline as well and consolidating just above it.
~~ We expect the pair resume to bull trend and head to the immediate resistance marked in the chart.
~~ The support zone marked in the chart can cap the declines.


NZDUSD.png
 
EUR/CHF Technical Analysis

~~ The strength of Swiss Franc bewilders us as it was able to contain the hottest currency like Euro.
~~ Despite EUR/USD & EUR/JPY moving to great heights, it is still in bearish territory and the counter has absorbed intense buying pressure.
~~ Technically, the formation resembles a round top and so a sell-off is on the cards when the Euro corrects against erstwhile currencies.

EURCHF.png
 
GBP/CHF Technical Analysis
  • The counter is currently in a 3-wave bear cycle.
  • Further, it is currently forming wave B in the form of a bearish flag pattern and is close to the resistance zone.
  • Hence, we expect the pair to find resistance around this area and commence its wave C.
Aug 28_GBPCHF.png
 
EUR/GBP Technical Analysis

~~ The counter is now on the verge of completing a 3-wave bear cycle.
~~ It is now approaching a strong demand zone which also coincides with the 61.8% retracement of the entire rally.
~~ We expect the pair to kickstart a fresh bull cycle from here.

EURGBP.png
 
USD/CHF Technical Analysis

~~ The counter has broken off from a falling wedge pattern.
~~ It is now hovering around the broken trendline.
~~ We expect the support zone to arrest any pullback and catapult the prices higher.

USDCHF.png
 
USD/SGD Long-term outlook
usdsgdchart.png


USD/SGD currency pair testing multi-year rising support.

On the 23rd of March this year the USD/SGD currency pair topped out at the 2nd of January 2017 highs (Double Top) and has since declined relentlessly. Now testing multi-year rising (A) and falling wedge support at (1). A good buying opportunity for the long term could present itself above (1) with 1.37300s as a first resistance zone to watch for, followed by 1.38449 and 1.39458 whereby a good selling opportunity could hinder the bulls’ efforts for the short term before the uptrend resumes.

Alternatively, if the bears can breach this dual support zone now in play, and push prices below the January ‘20 lows at 2 (1.34469) we can expect to see an increase in selling pressure forcing prices furthermore to low 133s, followed by 1.31665 and 1.30039 in extension.
 
AUD/USD Technical Analysis

~~ The counter has been in the declining mode for the last 2 days.
~~ It made an inverse head and shoulder and has broken the neckline.
~~ Further, it has broken the immediate trendline as well.
~~ Hence, we expect the pair to be bullish in the near-term.

AUDUSD ANALYSIS.png
 
Top