Long-Short trade

Closed Overseas Group

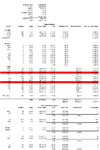
I had mentioned that any old idiot knew the BDI was recovering, which led me to question whether I was just too late in getting my position on. I added longs on two Shipping comapnies, and also have exposure through the US Steel / Arcelor Mittal long-short...

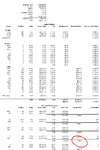
.. so I closed OSG - it has been underperforming consistently, I'm not keeping it any more - it's a duff trade. I am keeping the long-short (more to follow on this) and the other shipping company (NAT) - it outpeformed OSG just about all the time, and is now sitting at a small loss.

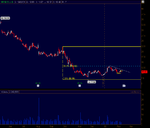
Closed @ 31.90 for a loss of 0.2590% of the portfolio as a whole, nearly 10% of the equiy allocated to this trade.

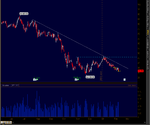
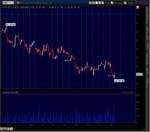
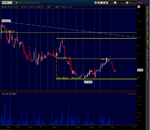
Looking at the charts, you can see I went long in an obvious downtrend (daily); and the position has never been a profitable one - in fact, I seem to have bought at a level that acted as resistance from the downside. HA!
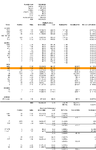
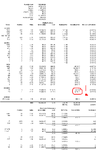
 

Attachments

  • OSG_Daily.PNG
    OSG_Daily.PNG
    47.3 KB · Views: 175
  • OSG_1hr.PNG
    OSG_1hr.PNG
    53.2 KB · Views: 163
Closed Whole Foods

If you remember I had said that Whole foods and Starbucks share the same customer base...

... well I'm not sure how accurate that is to be honest. In fact it might be total ********... I still think WFMI is a bad bet - people are losing jobs left right and centre, and people with no jobs are going to cut their household bills, which means shopping at Tesco rather than Waitrose. This is the case with WFMI IMO... but the trade has done nothing but lose dosh so it's time to get rid of it.

Looking at the charts, it seems I played the retracement perfectly... except I got my Buy and Sell orders the wrong way round (I closed it a couple of days ago, but have been busy). You can see the downtrend clearly, along with the small retracement (hourly) that I managed to have my short on for the duration of... (I had to double check when I saw this first time, lol).

Closed Whole foods @ 11.14, Portfolio loss of 0.1712%, and over 11.5% of the equity allocated to this trade.
 

Attachments

  • WFMI_Daily.PNG
    WFMI_Daily.PNG
    32 KB · Views: 157
  • WFMI_1hr.PNG
    WFMI_1hr.PNG
    57.5 KB · Views: 147
RE: PnL confusion

I had mentioned that I had made an error on my S'sheets. Well it turns out that its a little more complicated than I had anticipated (although not very). Basically the issue I have is reporting the PnL as a % of the capital invested - which happens to be changing every time I alter a position.

The solution is to report my PnL as a % of the maximum capital I can deploy - for instance, the Gross value of my positions at the moment is hovering about $65k - $70k. I am going to round up these figures, and so will report on a portfolio with $100k total ($70k equity $30k cash). This is going to knock the figures I have been reporting to the downside, obvioulsy - but as all the trades have been recorded, it should make it far easier to go back and create a time-series of the returns (I can simply download the daily data from Yahoo and do the sums using $100k as a capital base).

Until then, I have to re-balance the portfolio, and correct a slight **** up with the US Steel / Arcelor Mettal position sizes. Nearly all of my long-shorts have moved away from each other, and so I now have "un-hedged" equity positions. By re-hedging them I should lock in the gains so far (provided the correlations don't change, of course). Ideally I would be able to monitor a rolling-correlation in real time, but without live data into Excel I can't see it happening. Might have a play to see if I can write a custom indicator but not going to spend much time on it during the day.

So, thats where we are re: PnL - of the $100,000 the YTD PnL is +1.4291% (equals 2.159% of the equity actually invested). Of course, the extra cash I am going to invest / diversify currencies and earn interest / lend out in the money markets, which is something else to think about.

Lastly, I'm looking to get a pharmecuticals trade on... all this M&A means there should be some opportunities.
 
I'll need to go through and create additional worksheets for the other asset classes, then I can look at putting some of this extra cash to work. Until then, this is where we stand.
 

Attachments

  • Working_PnL.PNG
    Working_PnL.PNG
    44.3 KB · Views: 186
This is where we were @ the end of play yesterday... I tried to re-hedge the pair trades, which are listed as Adjustments below... the idea is to take the profits off the table, and leave me with positions that offset each other again.

Yesterday was a bad day, the second in a row. Taking a cursory glance at the PnL during the day, you can really see how letting the pair trades move away from each other brings in volatility to the portfolio.

Have to say, I am finding it tricly to keep an eye on how the trades are doing without looking at a chart! In an ideal world, I'd be pulling live prices into Excel and be doing rolling statistics on them (correlations, volatility, effectiveness of hedge, etc...) - but I have neither the tools / skills to set this up (without paying for it, that is!)

Over the weekend I will try and build up S'Sheets for adding in other asset classes... It is crazy (IMO) to have invested just over half the Capital and not be lending the rest out - so I will try and build up a worksheet for Bonds too, then I can but some T'Bills or lend it our overnight.

Anyway, this is where we were @ close last night.
 

Attachments

  • PnL.PNG
    PnL.PNG
    53.5 KB · Views: 182
At close of play today.

I'm encouraged to see the PnL calm down now that the positions have been re-aligned (except the one circled)... but I am also keen to get the rest of this capital working! the 1.3155% of $100k represents nearly 2% on what I have actually invested, and includes some costly mistakes!

In the CLOSED column you can see where I included the profits taken when I adjusted the position back in line... so I have realised losses of $508.73 and hold unrealised profits of $1,824.22

In terms of portfolio management, I am thinking about ditching the MCD vs BKC trade - if you recall, MCD was originally set against SBUX, but I cut it short as MCD couldn't keep up with the losses of th Starbucks trade - and it is losing again against BKC, something I thought would be "a sitter". Might ditch the pair.
 

Attachments

  • PnL.PNG
    PnL.PNG
    55.2 KB · Views: 192
this real money or paper? dunni if you already said

lol... paper, paper!!

It is basically an attempt at running a long-term (largely market neutral) book, instead of jumping in and out all day. The cash balance is set at $100,000, although I am treating it as $100,000,000 - for example, I may choose to put a yield curve position on, in which case I will reduce the $ per tick by 1,000 x what the exchange specifies... get me?
 
Looks like I forgot to post how things stood @ close of Play on Friday...

I have closed the MCD and BKC position at the prices shown... for some reason I havent figured out, if I transfer the trades into the 'ADJUST' or 'CLOSED' sections, the Sums don't add up. I have the times that I exited recorded in the platform, and will post when I sort out the S'sheets and stuff.

anyway, as of Friday 13th.
 

Attachments

  • PnL.PNG
    PnL.PNG
    54.7 KB · Views: 184
And today... MCD and BKC are highlighted in red to illustrate that they are closed positions, just in the wrong part of the spreadsheet.

Untidy, but to be honest I think I was unprepared with regard to monitoring my PnL etc... I just sort of jumped in at the deep end and now I am having to tie up loose ends. I would ideally like to re-start all the s'sheets from scratch, now that I've got a bit of an idea about what I want to do (this is always the case for s'sheets with me.. I'll jump right in, tackle it as best I can, then scrap the lot and build something from the ground up). I will try and get it sorted, but to be honest it might be a weekends work.

of the $100,000, about 60% is invested, returning +1.6304% YTD Gross, circa +2.7% on the capital deployed.

P.S. Does anyone have any ideas about soemthing I can use as a Benchmark?


EDIT: (spelling, and) I started on the 29th January 2009
 

Attachments

  • PnL.PNG
    PnL.PNG
    55.4 KB · Views: 186
Last edited:
The Gold:Silver ratio has been falling since the end of last year, so how about pairing short gold / long silver ?

The ratio currently stands at about 69 (ie: 69 ounces of silver required to buy 1 ounce of gold), down from 87.5 at the beginning of December. For 18 months up to summer 2008 the ratio was in a range of 45 - 60.

Chart available at Stocharts.com -
$GOLD:$SILVER - SharpCharts from StockCharts.com

Edit: Since posting the comments above I read the suggestion at MoneyWeek that gold may be due for a pullback before rising further (see Gold - Why it could be time to take profits). In fact, the writer goes on to suggest pairing long oil / short gold ...
 
Last edited:
Actually, the AXP vs. V pait trade was getting a bit out of line, so I sold 130 AXP shares to balance it out again. I chose to adjust the position all in AXP shares (rather than a combination of selling more AXP and selling some V too) because AXP have set new lows today, so it's clearly in a downtrend.
 
Going to add a yield curve steepener to my position...

Bought the TUT...

+2 ZT @ 108 27
-1 ZN @ 123 23

EDIT: These are the ratio's, not necessarily the amounts. I will see how many TUT's I can buy with $10,000 (which is sort of the same size as the other pair trades, $5,000 each) then see what the BPV is and take it from there. If anyone can tell me the SPAN requirements, and the reduction in margin I get because of the spread, I'd appreciate it.

Additionally, I really need some sort of Benchmark to compare my returns against - can anyone point me in the right direction???
 
Last edited:
Todays results, including the TUT trade and the adjustment to my AXP position. It is shown in orange here, to illustrate that I have changed the entry price to the average according to the adjustment ((230*17.46)+(130*13.95))/360.

Think I might have to re-hedge the Ford - General Motors trade and lock in some profits tomorrow, if you look in the "Ratio" column you can see that the positions are moving away from each other (I set each position so this ratio -> -1.00)...

Also, judging from the $PnL of the TUT trade, I am going to leave the position as it is - although I may well be able to get more TUT for the $10,000 I have allocated to it, I think it will introduce excess volatility to the portfolio if I did, and I started the whole thing out by stating "no leverage" which I have already broken (though in my defence, it really is rather tricky to put on a similar trade without using futures).

Some trades may have to go. The X - MT trade is underperforming, and I can't ever remember it posting a +ve PnL... That and my bloody OIL ETF, which looks to have been a "bottom picker" trade - at least I certainly have the sh!t on my hands now.

Lastly, if you want to know how some of my old trades are doing:

I closed SBUX short @ 10.33 w/ 9.50 entry... 9.65 now
I closed WFMI short @ 11.14 w/ 9.99.... 9.29 now
I closed MCD long @ 56.92 w/ 57.92 entry... 56.41 now
I closed BKC short @ 1.28 w/ 20.43 entry... 20.04 now
I closed OSG long @ 31.90 w/ 35.39 entry... 30.03 now
 

Attachments

  • PnL.PNG
    PnL.PNG
    57.7 KB · Views: 166
What concerns me about todays results is the alarming difference between the 2-year future and the 10-year futures (i.e. my TUT trade)... I used the recommended ratio's (infact I might have only used half the recommended) on the exchange website, because I found it a bit tricky to find the DV01 of the CTD bonds - infact I couldn't even find a list of deliverable bonds.

Think I might have to adjust this trade using the simple price / price method I've been using before... the 2 year has done absolutely bugger all to hedge the 10 year. Will try and have it sorted by the weekend.

Anyway, we broke +2% despite the yield curve trade today anyway :)
 

Attachments

  • PnL.PNG
    PnL.PNG
    58.2 KB · Views: 199
Ok, closing the TUT trade before things in the US kick off... if we see a flight to quality for the weekend I don't want to be caught with a 10yr short and an ineffective 2yr hedge. Will take the profits now and think about the trade - with ratio's that work - next week.

-2 ZT @ 108 29
+1 ZN @ 123 05

I admire your knowledge and in-depth analysis Mr Gecko, you really are on another wavelength....

are you an ex-broker from the city or have you learnt all this yourself?
 
Top